Migliora il reporting con le visualizzazioni a indicatori
Aggiungi indicatori ai report per offrire insight visivi chiari e in tempo reale che semplificano dati complessi ed evidenziano le prestazioni rispetto agli obiettivi.
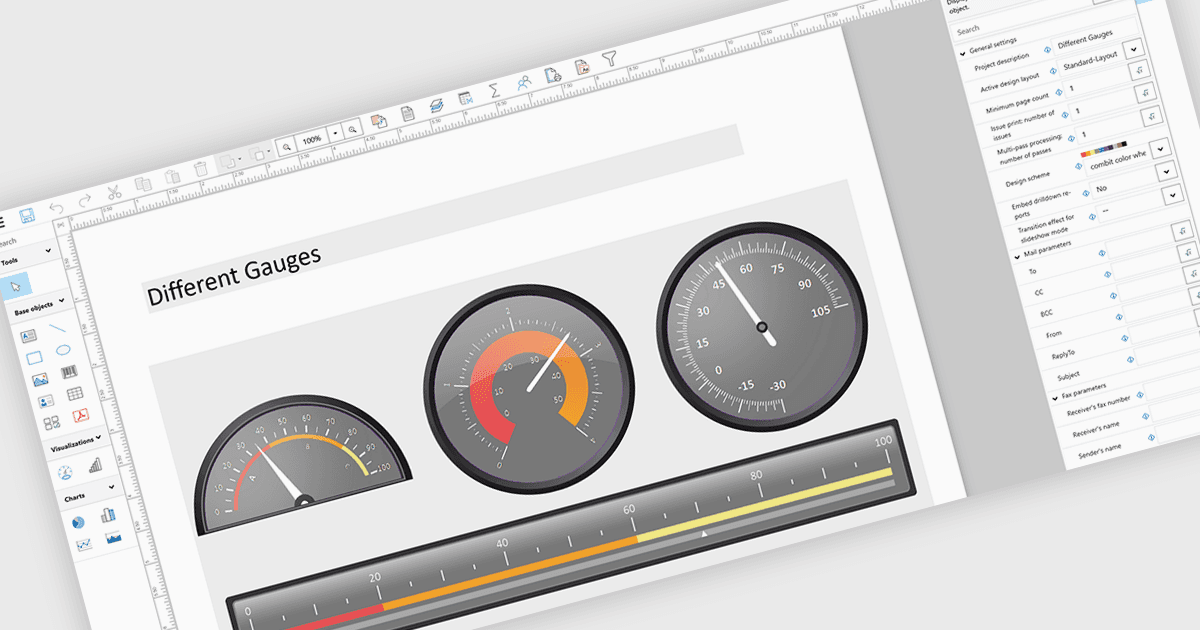
Aggiungere indicatori ai report significa incorporare indicatori visivi, come grafici in stile quadrante o misuratore, che mostrano metriche chiave rispetto a intervalli o obiettivi definiti, rendendo le prestazioni immediatamente comprensibili a colpo d'occhio. Questo approccio migliora la chiarezza dei report trasformando dati complessi o densi in elementi visivi intuitivi, aiutando gli utenti a valutare rapidamente se i valori rientrano in soglie accettabili, di avviso o critiche. Di conseguenza, gli indicatori favoriscono decisioni più rapide e informate, migliorano la comunicazione con gli stakeholder e creano report più coinvolgenti e facili da usare. I casi d'uso comuni includono il monitoraggio delle prestazioni di vendita rispetto alle quote, il controllo dello stato di salute o del tempo di attività del sistema, la visualizzazione dell'utilizzo del budget e la presentazione dell'avanzamento dei KPI nelle dashboard esecutive, dove informazioni rapide sono essenziali.
Diversi controlli .NET WPF Reporting includono Indicatori, tra cui:
- DevExpress Reporting consente di incorporare controlli indicatore personalizzabili nei report per visualizzare i KPI, permettendo un chiaro monitoraggio delle prestazioni e decisioni più rapide basate sui dati.
- Telerik Reporting consente di incorporare indicatori interattivi nei report, presentando metriche in tempo reale con elementi visivi intuitivi che migliorano la chiarezza e il coinvolgimento degli utenti.
- List & Label Enterprise Reporting Edition di combit facilita l'aggiunta di elementi indicatore ai report, aiutando gli utenti a evidenziare in modo efficace valori chiave, soglie e trend delle prestazioni.
- Stimulsoft Reports.WPF consente di progettare report ricchi con componenti indicatore, offrendo un feedback visivo preciso sulle metriche per migliorare il monitoraggio e l'analisi.
Per un'analisi approfondita di funzionalità e prezzi, visita il nostro confronto tra i controlli .NET WPF Reporting.