Crea Grafici a Torta Interattivi nelle App Vue.js
Visualizza le proporzioni delle categorie con grafici a torta reattivi che presentano tooltip, legende, etichette e animazioni.
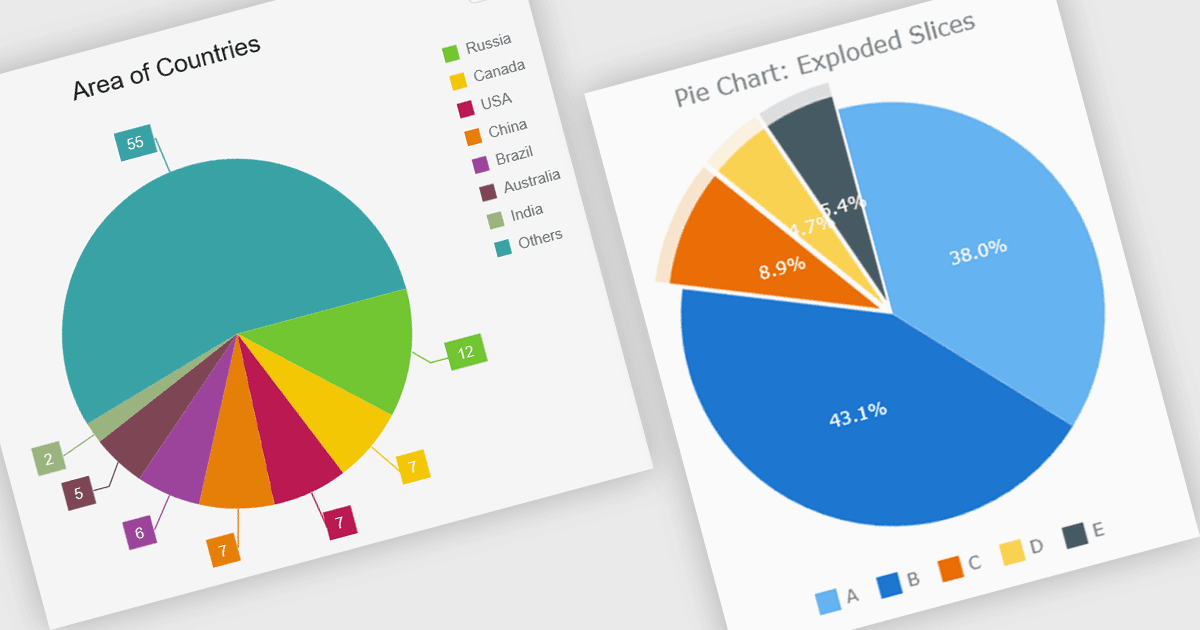
Un grafico a torta consente agli sviluppatori di mostrare i dati come fette proporzionali di un cerchio, con ogni fetta che rappresenta la quota di una categoria di un totale unico. È adatto a set di dati che mostrano relazioni parte-tutto, facilitando agli utenti il confronto delle proporzioni relative a colpo d'occhio. Un'implementazione ben progettata generalmente include funzionalità interattive come tooltip, legende, etichette, animazioni, layout reattivi e opzioni di personalizzazione, consentendo al grafico di integrarsi perfettamente nelle moderne applicazioni web e fornendo un modo chiaro e accessibile per presentare dati compositivi.
Diversi componenti chart Vue.js supportano i grafici a torta, tra cui:
- Highcharts Core consente di creare grafici a torta interattivi con ricca personalizzazione, layout reattivi, animazioni, tooltip, legende e opzioni di stile flessibili.
- DevExtreme Vue Chart (parte di DevExtreme Complete di DevExpress) permette di costruire grafici a torta reattivi
- con fette personalizzabili, etichette, legende, animazioni e tooltip interattivi.
- Kendo UI Vue Charts (parte di Kendo UI di Telerik) facilita la creazione di grafici con etichette configurabili, legende, tooltip, styling e rendering reattivo.
- AnyChart JS consente di sviluppare grafici a torta personalizzabili con tooltip interattivi, etichette configurabili, fette esplose, layout reattivi e ampie opzioni estetiche.
Per un'analisi approfondita delle caratteristiche e dei prezzi, visita la nostra comparazione dei componenti chart Vue.js.