Visualizza Dati Complessi con Pivot Chart
Crea pivot chart interattivi per visualizzare dati riepilogativi, scoprire tendenze e supportare un'analisi dati efficace.
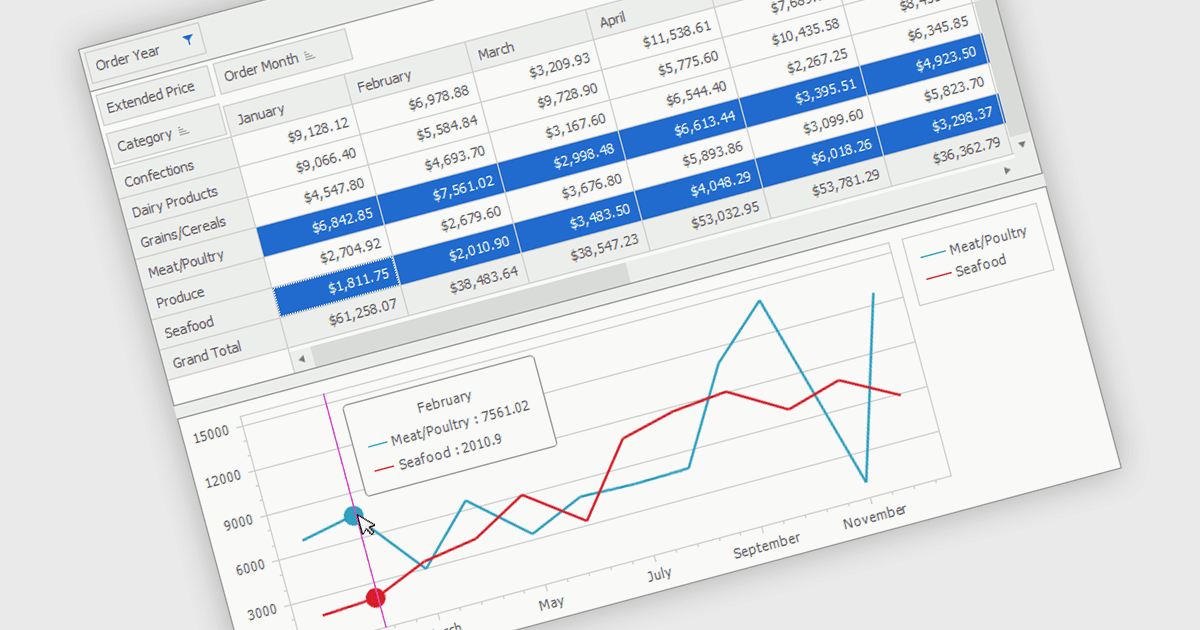
Un pivot chart è uno strumento di visualizzazione dati interattivo che funziona insieme a una pivot table per mostrare dati riepilogativi in formato grafico. Consente agli utenti di analizzare set di dati modificando dinamicamente categorie, serie e filtri senza alterare i dati di origine. Presentando visivamente tendenze, confronti e modelli, i pivot chart rendono più semplice interpretare informazioni complesse e supportano decisioni più rapide. Sono ampiamente usati in business intelligence, reporting e analisi dati dove è importante esplorare in modo flessibile dati aggregati.
Diverse suite UI .NET WinForms offrono funzionalità di pivot chart, tra cui:
- DevExpress WinForms consente di creare pivot chart interattivi che visualizzano riepiloghi di Pivot Grid, rivelano tendenze e semplificano l'analisi multidimensionale dei dati.
- ComponentOne Studio WinForms di MESCIUS permette di creare pivot chart da dati riepilogativi per un'analisi delle tendenze e reporting più chiari.
- Syncfusion Essential Studio UI Component Suite facilita pivot chart interattivi che trasformano i riepiloghi di Pivot Table in insight visivi per un'analisi di business efficiente.
Per un'analisi approfondita di funzionalità e prezzi, visita il nostro confronto delle suite UI .NET WinForms.