Naviga grandi set di dati con lo scorrimento del grafico
Esplora grandi set di dati con lo scorrimento orizzontale e verticale del grafico, migliorando la leggibilità e offrendo un accesso rapido a approfondimenti dettagliati.
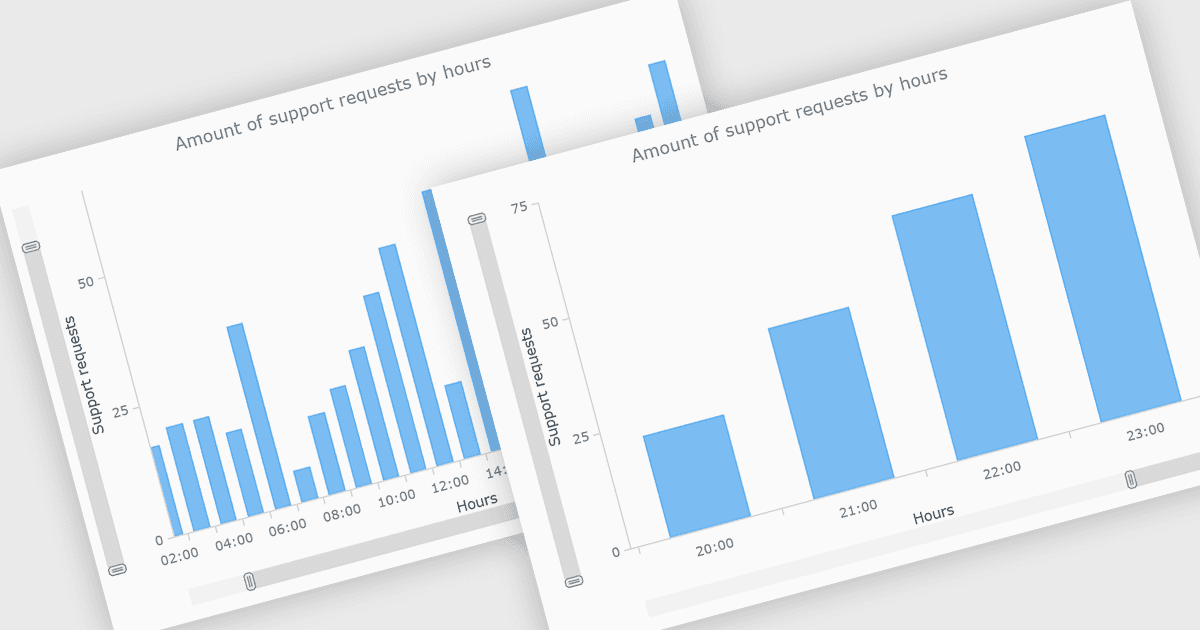
Lo scorrimento del grafico consente agli utenti di navigare grandi set di dati spostandosi orizzontalmente o verticalmente attraverso un grafico senza mostrare tutti i punti dati contemporaneamente. Questo migliora la leggibilità, riduce il disordine visivo e facilita l'esplorazione di periodi di tempo specifici, categorie o intervalli di valori mantenendo l'accesso all'intero set di dati. È particolarmente utile per dashboard, report finanziari, applicazioni di business intelligence e altre visualizzazioni ad alta densità di dati in cui gli utenti devono analizzare grandi volumi di informazioni in modo efficiente.
Diversi controlli jQuery per grafici offrono grafici a imbuto, tra cui:
- Kendo UI jQuery Charts di Telerik consente di esplorare set di dati complessi attraverso lo scorrimento interattivo del grafico, riducendo il disordine visivo e semplificando l'analisi di informazioni dettagliate.
- DevExtreme jQuery Chart di DevExpress permette di scorrere orizzontalmente e verticalmente attraverso i dati del grafico, consentendo un'analisi mirata senza sovraccaricare la visualizzazione.
- AnyChart JS consente di navigare grandi set di dati con uno scorrimento fluido del grafico, rendendo le visualizzazioni dettagliate più facili da esplorare mantenendo leggibilità e prestazioni.
- Infragistics Ultimate UI for jQuery Chart facilita una navigazione senza interruzioni attraverso set di dati ad alto volume con lo scorrimento del grafico, aiutando gli utenti a ispezionare le tendenze mantenendo la chiarezza visiva.
Per un'analisi approfondita delle funzionalità e dei prezzi, visita il nostro confronto dei controlli jQuery per grafici.