LightningChart .NET

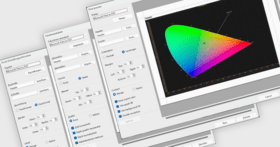
LightningChart .NET is a high performing charting library for desktop application development, fully GPU-accelerated with a rendering capacity of 16 billion data points in real-time with low-resource consumption, suitable for the most demanding industries with a 170+ library of 2D and 3D graphics. "LightningChart has proven to be the fastest charting library in the world for desktop and web." says Pasi Tuomainen, LightningChart CEO. As ultra-high performant .NET charts for WPF, WinForms and UWP, LightningChart .NET is meant to be implemented in demanding industries’ (science and research, engineering, economics and finance, medicine, energy, space and defense) data visualization application development.

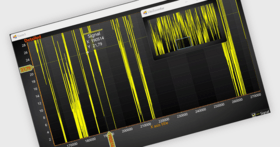
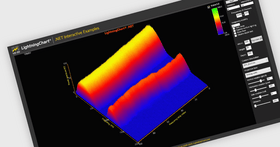
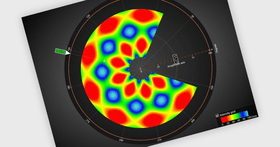
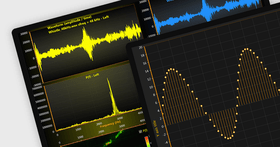
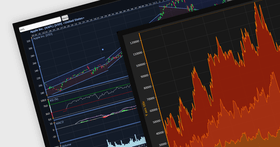
Visualize complex and huge data sets, with LightningChart's optimized series types.
LightningChart .NET has recently introduced the SampleDataBlockSeries which is the optimal series type to visualize scrolling/sweeping real-time data with very low variations in refresh intervals, it gives a smooth monitoring experience, much better than before. The SampleDataBlockSeries line series uses less RAM and CPU resources, provides a higher FPS and a significantly better responsiveness to user...

Ultime Notizie

Naviga tra i grafici con una finestra di zoom flessibile
October 29, 2025Product Update
LightningChart .NET v12.4.1 aggiunge LiteZoomBar, consentendo agli utenti di visualizzare set di dati completi concentrandosi sulle aree chiave per rivelare modelli in dati complessi.
Migliora le visualizzazioni dei dati nei progetti .NET 9
April 24, 2025Product Update
LightningChart .NET v12.2.1 aggiunge il supporto per Microsoft .NET 9 per fornire funzionalità di creazione di grafici ad alte prestazioni nell'ultimo framework .NET.
Visualizza e analizza dati ciclici o Angular
June 18, 2024Product Update
LightningChart .NET v12 aggiunge un nuovo tipo di serie polare mappa termina/griglia di intensità per la visualizzazione di dati polari complessi con valori di intensità.
Ottimizza il rendering del testo del grafico ad alta risoluzione DPI
February 19, 2024Product Update
LightningChart .NET v11.0.1.1 offre un testo nitido su tutte le risoluzioni dello schermo, garantendo una visualizzazione straordinaria dei grafici su qualsiasi display.
Crea diagrammi e grafici avanzati per .NET 8
January 12, 2024Product Update
LightningChart .NET 10.5.1.1 aggiunge il supporto per .NET 8, consentendo agli sviluppatori di integrare la funzionalità di visualizzazione dei dati nelle applicazioni .NET 8.
LightningChart aggiunto al confronto dei grafici .NET
June 30, 2023Comparison Update
Confronta le funzionalità di LightningChart con un'ampia gamma di grafici alternativi per .NET.

Prezzi da: US$ 1,347.50

The license is granted for one developer only, and one machine. .NET Individual license is available as Bronze, Silver, Gold or Platinum packages for WPF, Winforms and UWP or as a bundle of all...

Hai una domanda?

Chatta live con i nostri specialisti di gestione delle licenze di LightningChart ora.

Caratteristiche principali

LightningChart
Come distributori ufficiali e autorizzati, ComponentSource vi fornisce legittime licenze direttamente da LightningChart.
Component Type
  • .NET WinForms
  • .NET WPF
  • UWP Controls

Riconoscimenti recenti

PublisherPublisherPublisher