보간으로 Geo 열지도를 강화
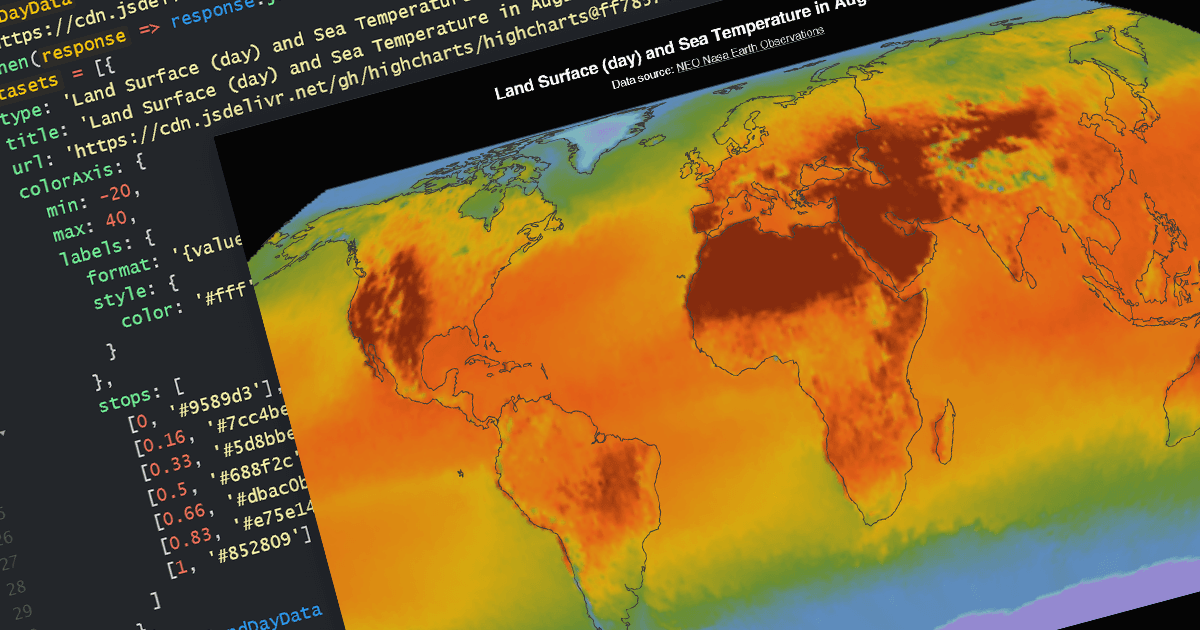
Highcharts Maps v11.2.0은 지리 열지도 보간(interpolation)을 지원하여, 온도 지도와 같은 차트에 알려진 데이터 포인트 사이의 추정 값을 추가할 수 있도록 해줍니다.
Highcharts Maps는 웹 기반 프로젝트에서 도식 지도를 생성하기 위한 표준을 준수하는 방법을 제공합니다. 이는 사용하기 쉬운 Highcharts JavaScript API를 확장하여, 웹 개발자가 판매, 선거 결과 또는 그 밖의 지리적으로 관련된 정보를 표시하는 대화형 지도를 만들 수 있도록 해줍니다.
Highchartts Maps v11.2.0 릴리스에서는 지리 열지도(heatmap)에 대한 보간(interpolation) 지원이 추가됩니다. geoheatmap.interpolation 기능을 사용하면 열지도의 데이터 포인트를 보간된 이미지로 렌더링하여, 알려진 데이터 포인트 사이의 값을 추정할 수 있습니다. 예를 들어, 특정 지역 내의 특정 지점에서의 온도를 보여주는 온도 데이터 표가 있을 수 있습니다. 보간을 사용하면 알려진 데이터 포인트 사이 영역의 온도를 추정할 수 있습니다. 이 새로운 기능은 데이터 세트가 제한적일 때도 더 쉽게 이해할 수 있고 시각적으로 매력적인 열지도를 만드는 데 도움이 됩니다.
버전 11.2.0에서 새롭게 추가된 사항의 전체 목록은 릴리스 노트를 확인하세요.
자세한 내용은 Highcharts Maps 제품 페이지를 방문하세요.