Add Candlestick Charts to Your WinForms Apps
Candlestick charts visually capture price movement, open/close, and highs/lows, revealing market sentiment and trading opportunities.
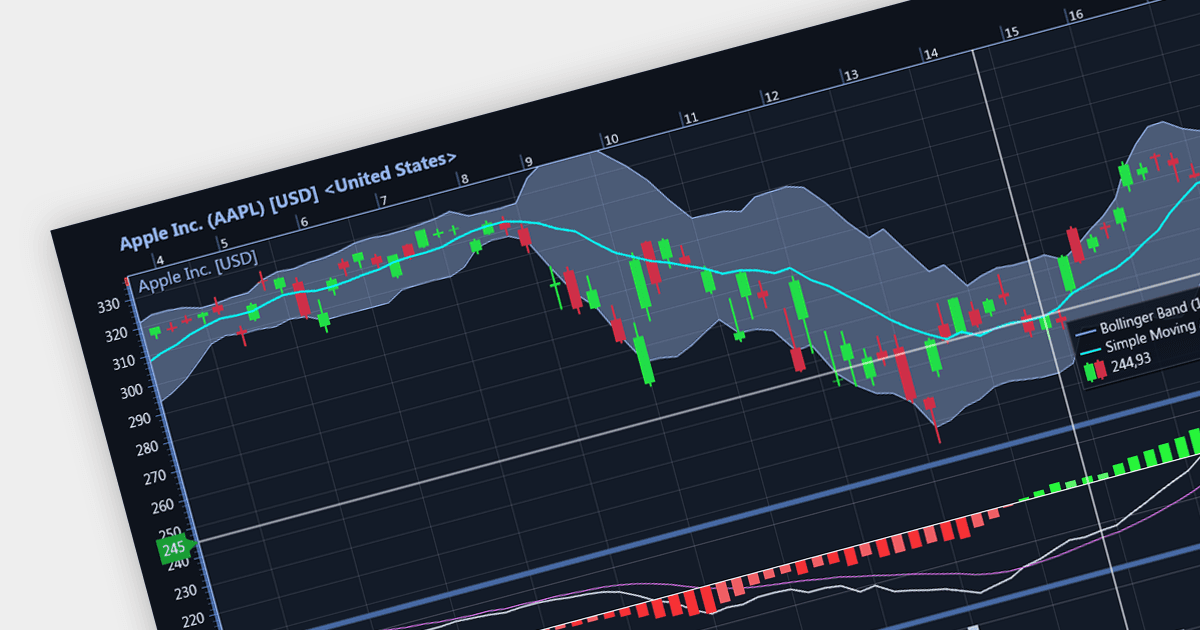
Candlestick charts are a style of financial chart used to describe price movements of a security, derivative, or currency. Each "candlestick" typically shows one day, with the central "box" representing the range between the opening and closing prices and the lines showing highs and lows. Their unique visual format helps traders to quickly understand market sentiment.
Several WinForms chart controls offer Candlestick charts including:
- DevExpress WinForms Chart (part of DevExpress WinForms) provides precision control over every candlestick aspect, from shadows to wicks, ideal for technical analysis.
- ComponentOne Charts for WinForms (part of ComponentOne Studio WinForms) includes built-in candlestick templates and financial indicators that accelerate market analysis.
- Telerik Windows Forms ChartView (part of Telerik UI for WinForms) provides streamlined candlestick rendering with smooth zooming/panning, ideal for dynamic trading platforms.
- Syncfusion WinForms Chart (part of Syncfusion Essential Studio Enterprise) offers extensive customization options that let you tailor candlesticks to your trading needs.
- LightningChart .NET provides fast candlestick updates that keep you ahead of the market, perfect for real-time trading dashboards.
For an in-depth analysis of features and price, visit our WinForms chart controls comparison.