Visually Represent Stages in a Process
Use funnel charts to analyze sales pipelines, customer conversion rates, or website visitor flows, identifying bottlenecks and optimizing efficiency.
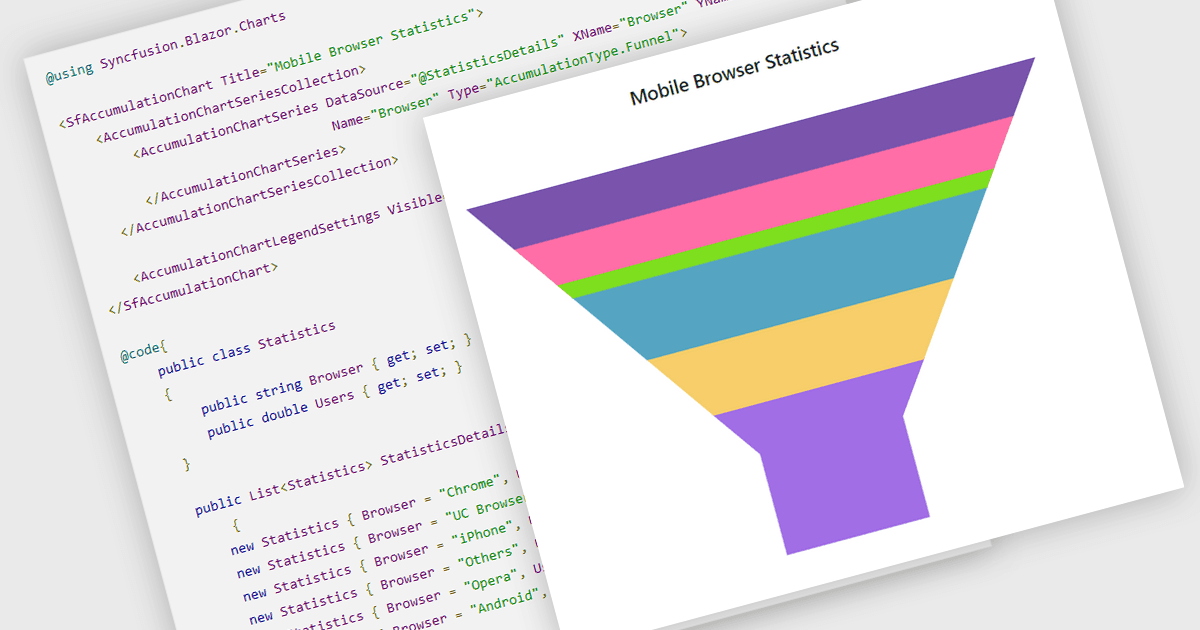
Funnel charts are a type of data visualization that depicts data in a linear process that often narrows down at each stage, resembling a funnel. They are especially useful for emphasizing steps in a process, displaying drop-off rates, and finding bottlenecks in workflows. Funnel charts are useful because they visually show the continual reduction of data throughout phases, providing clear insights into conversion rates and process efficiency. This enables engineers and business analysts to quickly find areas for improvement, optimize procedures, and create more accurate data-driven decisions.
Several .NET Blazor chart controls offer funnel charts including:
- ComponentOne Charts for Blazor (part of ComponentOne Blazor Edition by MESCIUS) includes funnel charts to visualize sequential stages in a process such as order fulfillment.
- Infragistics Blazor Charts (part of Infragistics Ignite UI) allows you to represent linear data processes with funnel charts, pinpointing critical areas for process improvement.
- Syncfusion Blazor Charts (part of Syncfusion Essential Studio Enterprise) enables clear visualization of conversion rates using funnel charts, aiding in optimizing workflows.
- Smart UI Blazor Chart (part of Smart UI by Smart HTML Elements) lets you effectively display funnel-shaped data progressions, providing insights into phases of a process.
For an in-depth analysis of features and price, visit our .NET Blazor chart controls comparison.