


Official Supplier
As official and authorized distributors, we supply you with legitimate licenses directly from 200+ software publishers.
See all our Brands.
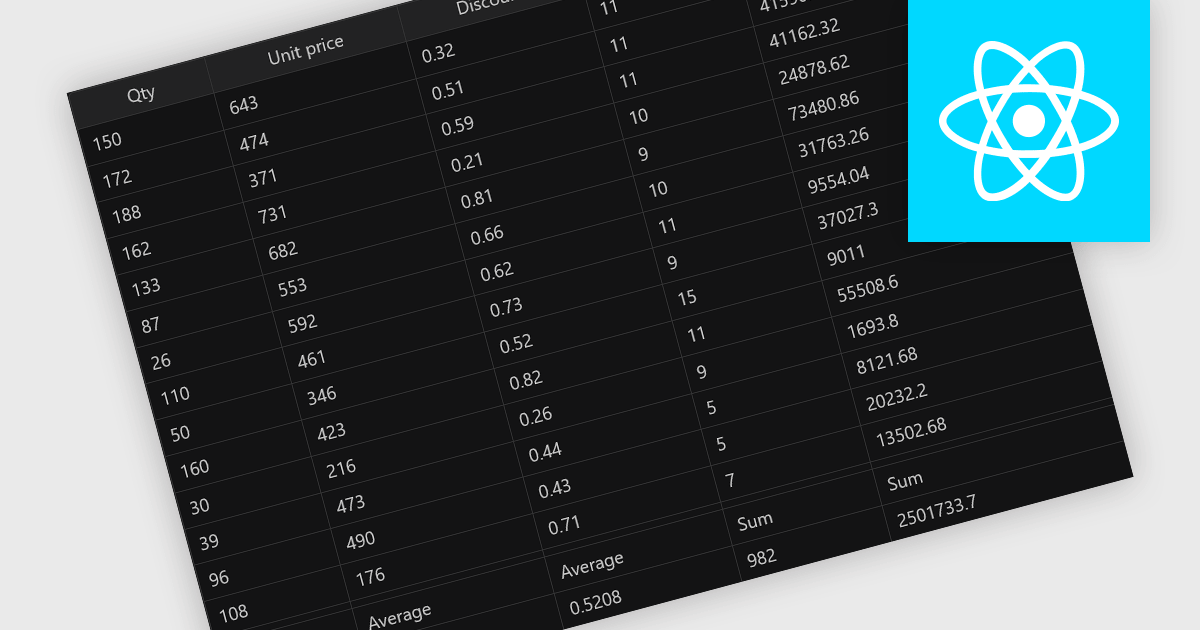
Aggregation in grid components allows users to automatically compute and display summary values, such as totals, averages, minimums, and maximums, across rows or columns of data. This feature enhances the analytical capability of a data grid by offering quick insights directly within the interface, reducing the need to export data for external processing. It is particularly valuable in business intelligence dashboards, financial applications, and administrative tools where on-the-fly data synthesis is essential.
Several React grid controls offer aggregation including:
For an in-depth analysis of features and price, visit our React grid controls comparison.


Tel: (888) 850 9911
Fax: +1 770 250 6199


