Add Location Insights to Your Reports
Maps in reports enhance visual clarity with engaging visuals that reveal geographic patterns and support more informed decision-making.
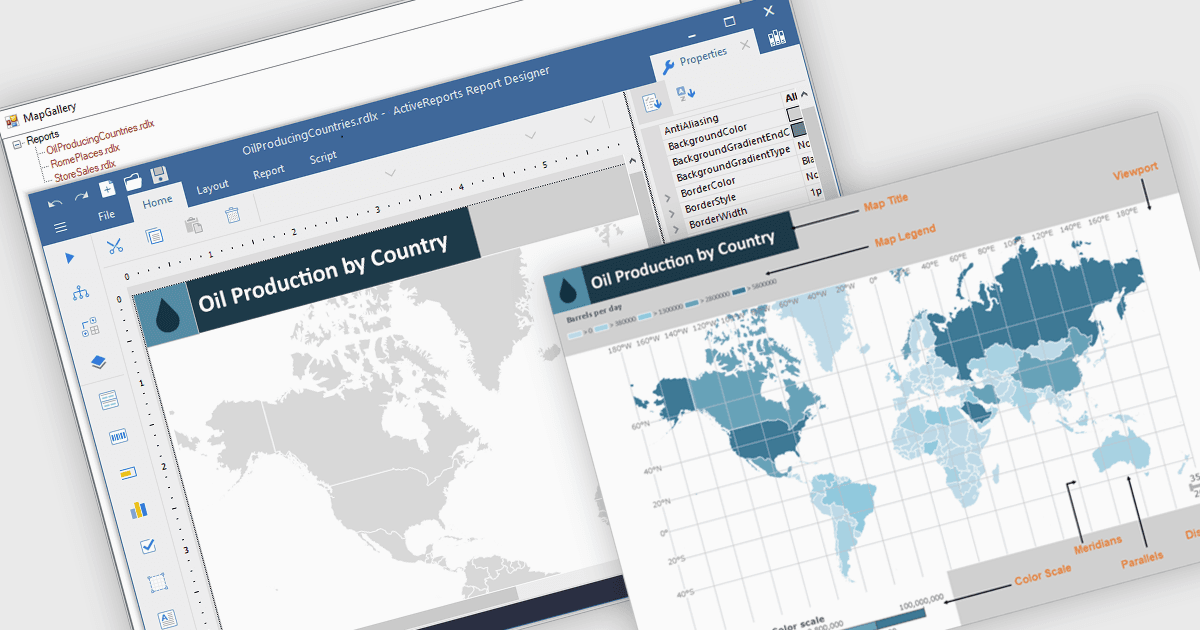
Maps in reports are visual tools that display geographic data, allowing users to see where activities, trends, or values occur across specific regions. By translating complex location-based information into clear and intuitive visuals, maps enhance understanding, highlight spatial patterns, and reveal insights that might be missed in tables or charts. This added layer of geographic context supports more informed decision-making and more compelling data storytelling. Common use cases include tracking regional sales performance, mapping customer distribution, analyzing service coverage, and presenting market expansion opportunities. Whether static or interactive, maps make reports more engaging and impactful for both technical and non-technical audiences.
Several .NET reporting controls offer maps, including:
- Stimulsoft Reports.Web lets you integrate interactive maps into reports for visualizing geographic data with dynamic drill-down and region-specific detail.
- FastReport .NET allows you to embed detailed maps in reports, helping users analyze spatial data and identify regional trends at a glance.
- Telerik Reporting enables dynamic map integration to visually present geospatial insights, enhancing clarity and context for data across different geographic areas.
- ActiveReports.NET facilitates the use of layered map visuals within reports to display location-based data and reveal meaningful geographic patterns efficiently.
For an in-depth analysis of features and price, visit our comparison of .NET reporting controls.