Animate Charts in Vue.js Applications
Using animation allows developers to create more engaging charts that facilitate an easier understanding and interpretation of the data.
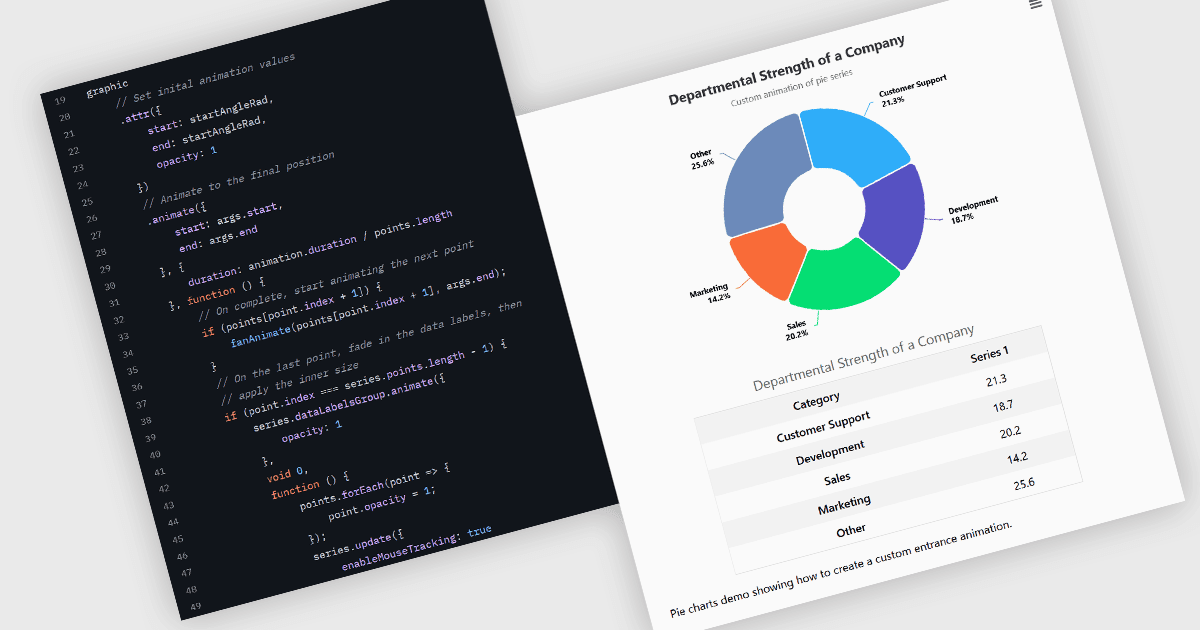
Animation in charts is a feature used in data visualization to visually transition between different data states or configurations. This technique helps communicate changes in data over time or between user interactions in a smooth, progressive manner. Rather than instantly switching from one state to another, animation introduces motion that can guide users’ attention, reinforce patterns, and reduce confusion. It is particularly useful in interactive dashboards and real-time analytics, where users benefit from a clearer understanding of what has changed and how.
Several Vue.js charting components support the use of animations, including:
- DevExtreme Chart (part of DevExtreme by DevExpress) offers high-performance Vue components for data visualization that integrate configurable animation options.
- Wijmo FlexChart and FinancialChart (part of Wijmo by MESCIUS) incorporates various animation modes and timing controls for visualizing data in web applications.
- Highcharts Core by Highsoft is a JavaScript charting library that can equip Vue.js apps with advanced animation functionality for highlighting data and aiding data interpretation.
- Kendo UI for Vue Chart (part of Kendo UI by Telerik) features built-in animations that respond to data changes in real-time, creating engaging transitions by default.
For an in-depth analysis of features and price, visit our comparison of Vue.js chart components.