


Official Supplier
As official and authorized distributors, we supply you with legitimate licenses directly from 200+ software publishers.
See all our Brands.
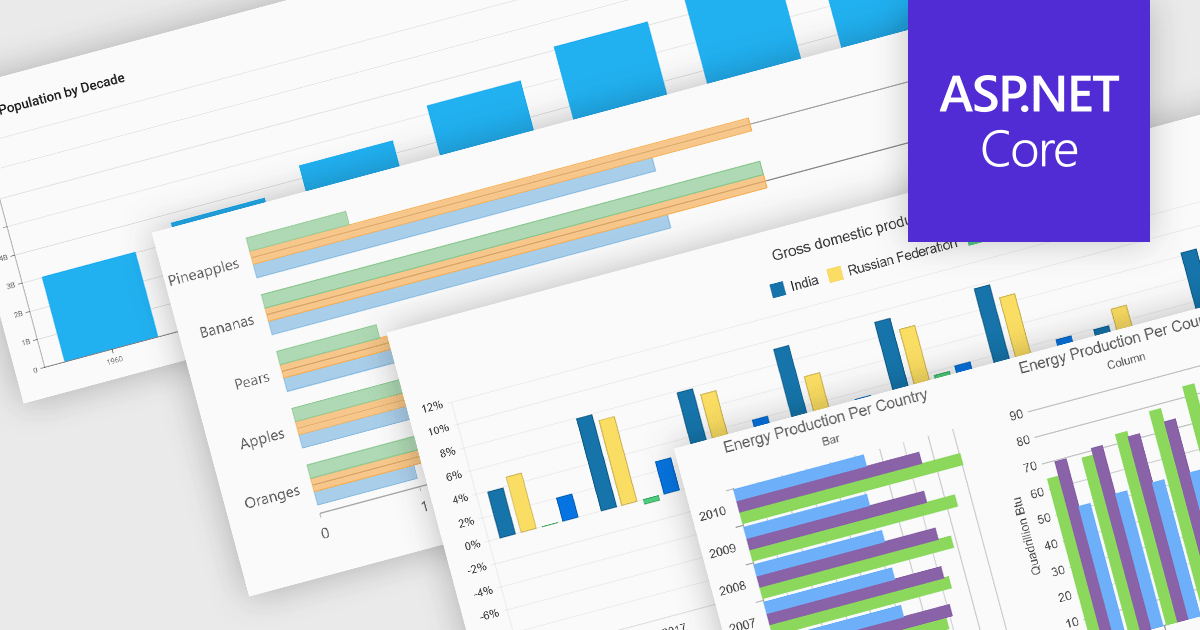
Column and bar charts form fundamental visualization tools in many charting suites. These chart types use vertical (column) or horizontal (bar) bars to represent quantitative data across categories, making them ideal for straightforward comparisons. Typically, you can display single or multiple series, stack values to show cumulative totals, or group categories to highlight differences. Their simplicity and clarity make column and bar charts a staple in dashboards, business reports, and analytics applications where rapid insight is required.
Several ASP.NET Core chart controls offer support for column & bar charts including:
For an in-depth analysis of features and price, visit our ASP.NET Core chart controls comparison.


Tel: (888) 850 9911
Fax: +1 770 250 6199


