Display Key Metrics for Immediate Assessment
Create dashboards and monitoring tools that present real-time numeric data using gauge controls for efficient data visualization in .NET apps.
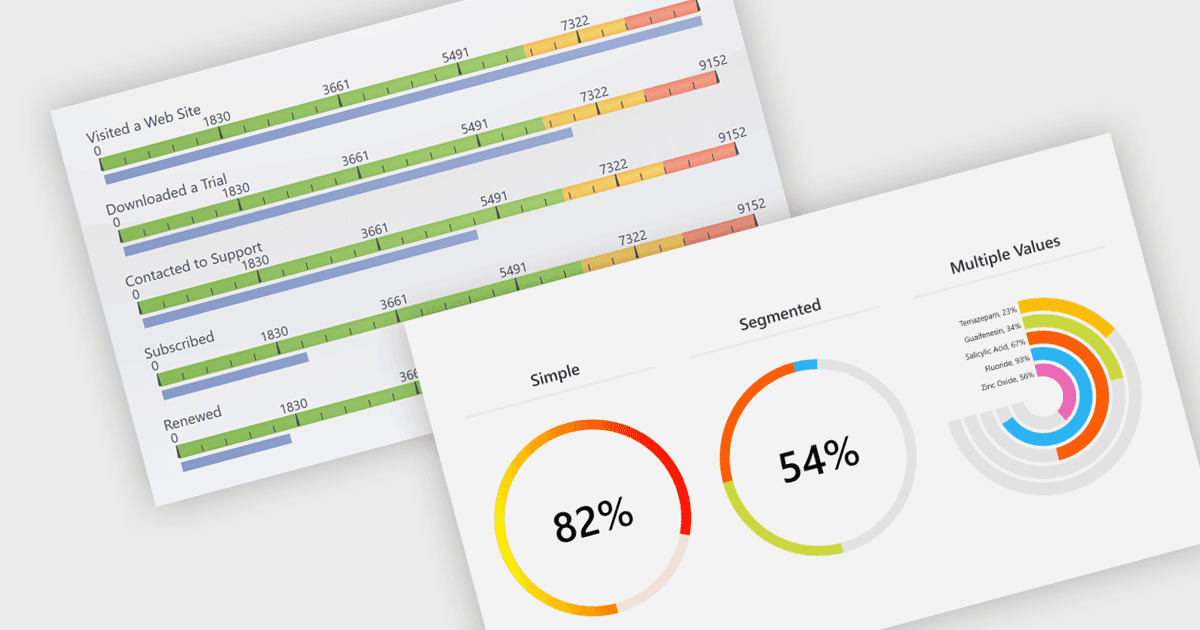
Gauges are specialized charting components used to visually display numerical values within a predefined range, often in formats such as radial, linear, or digital meters. They are commonly found in dashboards and monitoring tools, where their primary function is to provide immediate visual feedback on performance indicators or system metrics. Gauges are particularly useful for clearly communicating real-time data, allowing users to quickly assess the current state of a metric to determine whether a value is within acceptable limits or requires attention.
Several .NET charting components also offer gauges, including:
- DevExpress WPF Chart (part of DevExpress WPF) provides a variety of interactive gauge controls and pre-designed layouts that can be embedded into WPF applications.
- ComponentOne Charts for WinForms (part of ComponentOne Studio WinForms by MESCIUS) enables you to design advanced and highly customizable gauges.
- Telerik ASP.NET AJAX Chart (part of Telerik UI for ASP.NET AJAX) offers customizable arc, circular, radial and linear gauge controls for visualizing metric values effectively.
- Syncfusion Blazor Chart (part of Syncfusion Essential Studio UI Component Suite) includes gauges with customizable circular or linear scales, suited for dashboards and monitoring.
For an in-depth analysis of features and price, visit our comparison of .NET chart components.