Add Indicators to Highlight Trends in Blazor Charts
Enhance data interpretation by overlaying calculated trends and thresholds directly onto your visualizations.
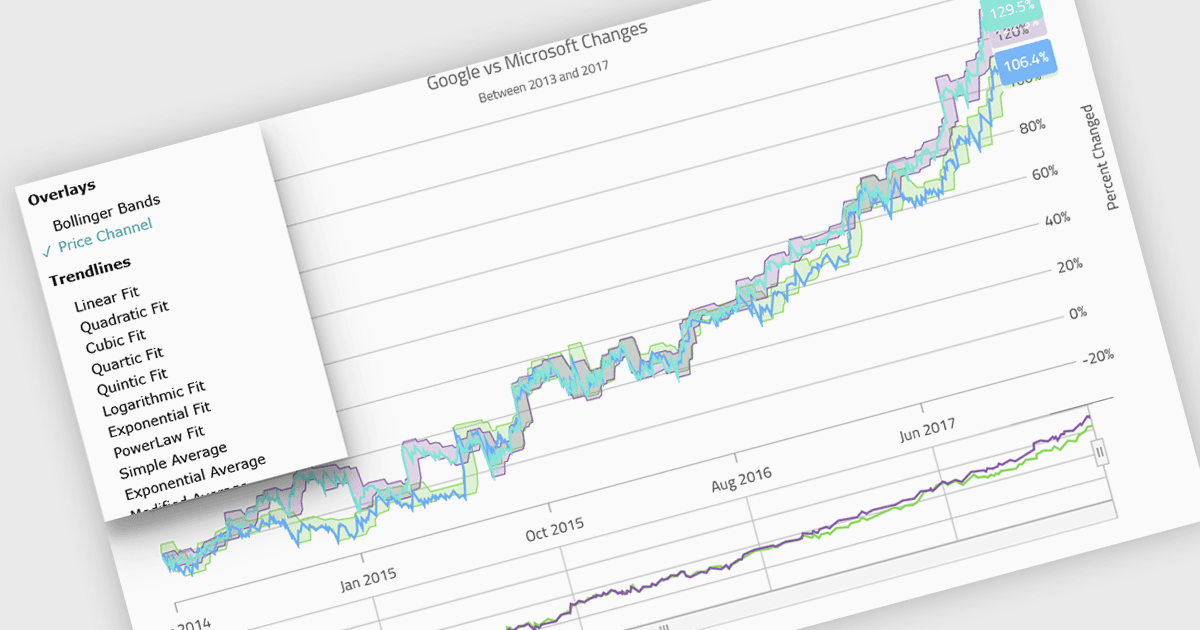
Indicators in a chart component are visual tools used to represent specific statistical or mathematical calculations directly on the chart, often to highlight trends, patterns, or key thresholds within the underlying data. Common in financial and analytical applications, indicators can include elements like moving averages, Bollinger Bands, or threshold lines. For software developers, implementing indicators provides a powerful way to enhance data interpretation by allowing users to see meaningful context and actionable insights without needing to leave the chart interface. This improves decision-making and supports more interactive and informative visualizations across a wide range of use cases.
Several .NET Blazor charting controls support indicators including:
- TeeChart .NET for Blazor by Steema Software lets you embed over 50 financial and statistical indicators directly into interactive Blazor charts.
- NOV Chart for .NET by Nevron allows you to apply a full suite of financial, trend and statistical indicators on 2D/3D charts, supporting large‑scale data rendering.
- Infragistics Ignite UI for Blazor Chart (part of Infragistics Ignite UI) lets developers overlay trend lines and data‑analysis overlays on its 65+ chart types.
- Syncfusion Blazor Charts (part of Syncfusion Essential Studio Enterprise) allows integration of analytical overlays such as trendlines and reference markers to enrich chart data.
For an in-depth analysis of features and price, visit our comparison of .NET Blazor Chart Controls.