Discover Insights with Interactive Chart Zooming
Examine critical data points more closely, reducing visual complexity and enabling accurate trend analysis across even the most complex datasets.
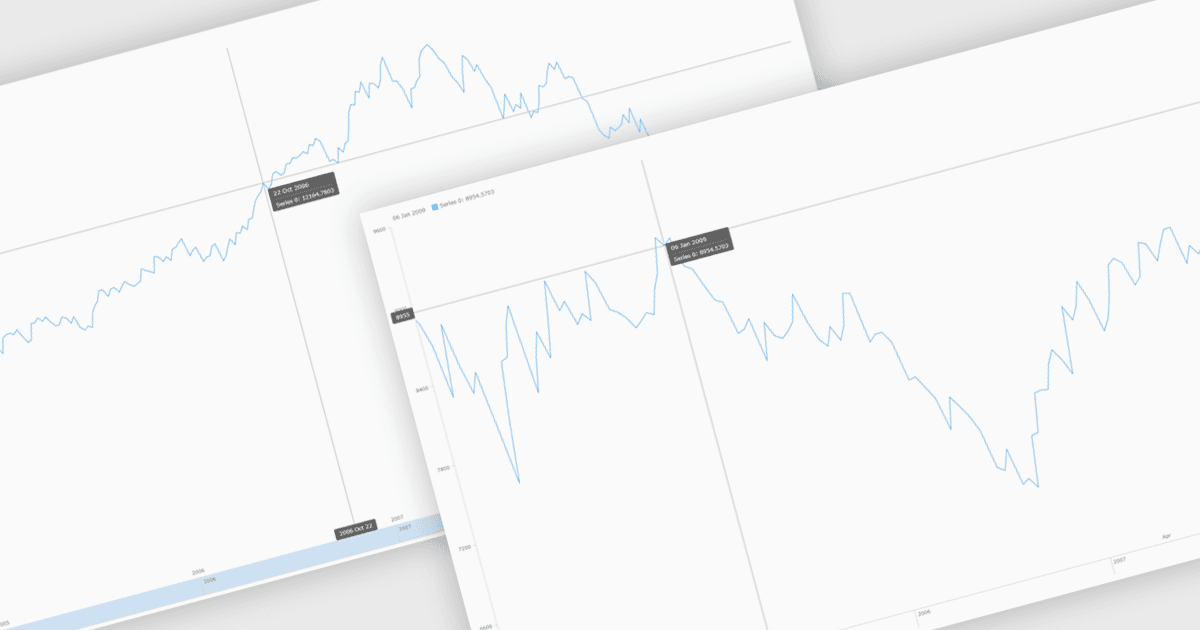
Chart zooming allows users to interactively adjust the visible range of a chart to focus on specific data points, time periods, or value ranges for closer analysis. By enabling users to zoom in and out dynamically, it reduces visual clutter, improves clarity, and helps uncover trends, anomalies, or patterns that may be difficult to identify at a full-scale view. This interactive capability supports faster, more informed decision-making by allowing movement between high-level overviews and detailed insights without reloading data. Common use cases include analyzing financial performance over specific timeframes, investigating spikes or drops in operational metrics, reviewing detailed sensor or monitoring data, and highlighting key data segments during presentations or stakeholder reviews.
Several JavaScript chart controls support zooming including:
- Highcharts Core lets you interactively zoom charts to explore dense datasets, isolate time ranges, and analyze trends with responsive controls.
- KendoReact Charts (part of KendoReact by Telerik) allows you to zoom precisely, helping applications deliver clearer insights through focused data exploration.
- AnyChart JS facilitates intuitive chart zooming, enabling users to examine detailed data segments while maintaining performance, flexibility, and visual clarity.
- LightningChart JS lets you perform high-performance chart zooming for large-scale datasets, supporting real-time analysis with precision and responsiveness demands.
For an in-depth analysis of features and price, visit our comparison of JavaScript Charts.