Highlight Trends with Heat Map Charts
Use color-based data representation to reveal patterns and anomalies across matrix-style datasets within a chart component.
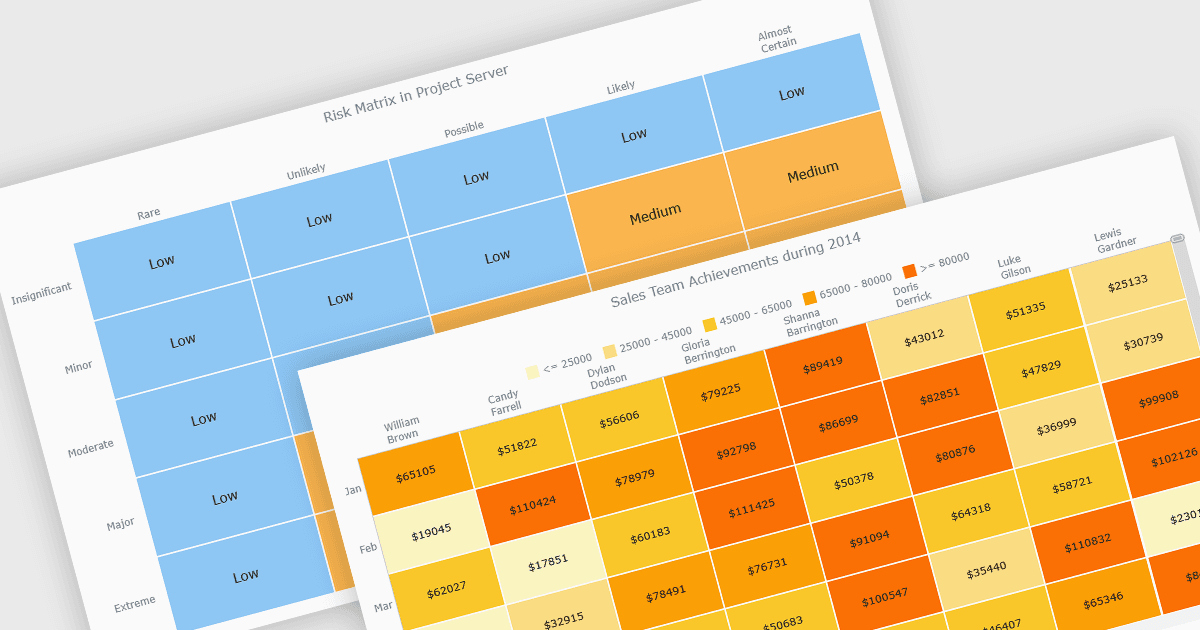
A heat map is a data visualization that displays values in a grid of colored cells, where color intensity represents the magnitude or importance of the data. This approach makes it easy to quickly identify patterns, trends, and outliers that may be difficult to see in traditional tables. Heat maps improve data analysis by visually highlighting relationships between two variables and enabling quick comparisons across datasets. They are commonly used in risk matrices, performance monitoring, sales analysis, and user behavior tracking, where color-coded insights help users focus on the most significant information.
Several JavaScript chart controls support the Heat map chart types, including:
- Highcharts Core by Highsoft lets you create interactive heatmaps that visualize matrix data with color-coded values, revealing patterns, trends, and comparisons across categories.
- LightningChart JS allows you to render high-performance heatmaps for large datasets, using GPU acceleration to reveal patterns, intensities, and correlations in real time.
- AnyChart JS facilitates building customizable heatmaps that transform tabular data into color-encoded grids, helping users detect trends, correlations, and data distribution.
- JSCharting lets you build interactive heatmaps that highlight value intensity through color ranges, enabling fast comparison, pattern discovery, and intuitive analysis.
For an in-depth analysis of features and price, visit our comparison of JavaScript chart controls.