Visualize Complex Data with Pivot Charts
Create interactive pivot charts to visualize summarized data, uncover trends, and support effective data analysis.
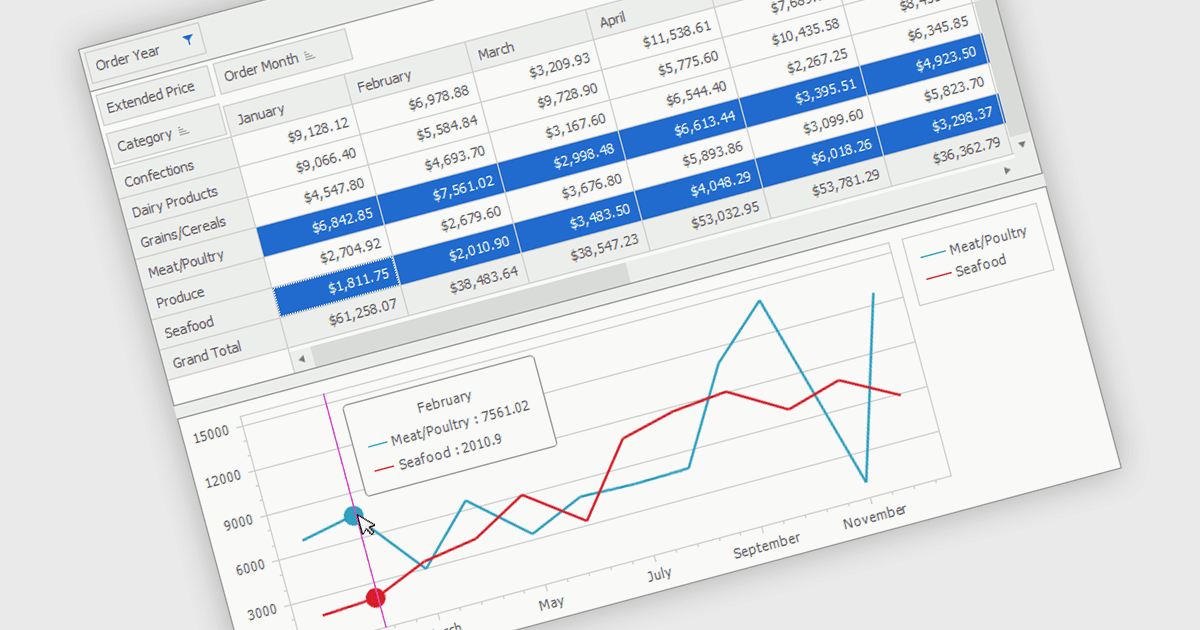
A pivot chart is an interactive data visualization tool that works alongside a pivot table to display summarized data in a graphical format. It enables users to analyze datasets by dynamically changing categories, series, and filters without altering the source data. By presenting trends, comparisons, and patterns visually, pivot charts make complex information easier to interpret and support faster decision making. They are widely used in business intelligence, reporting, and data analysis where flexible exploration of aggregated data is important.
Several .NET WinForms UI suites provide you with pivot chart functionality, including:
- DevExpress WinForms lets you create interactive pivot charts that visualize Pivot Grid summaries, reveal trends, and simplify multidimensional data analysis.
- ComponentOne Studio WinForms by MESCIUS allows you to create pivot charts from summarized data for clearer trend analysis and reporting.
- Syncfusion Essential Studio UI Component Suite facilitates interactive pivot charts that transform Pivot Table summaries into visual insights for efficient business analysis.
For an in-depth analysis of features and price, visit our comparison of .NET WinForms UI suites.