Highlight Insights with Chart Annotations
Add context to your charts, emphasize important trends and data points, and make meaningful insights easier to identify and understand.
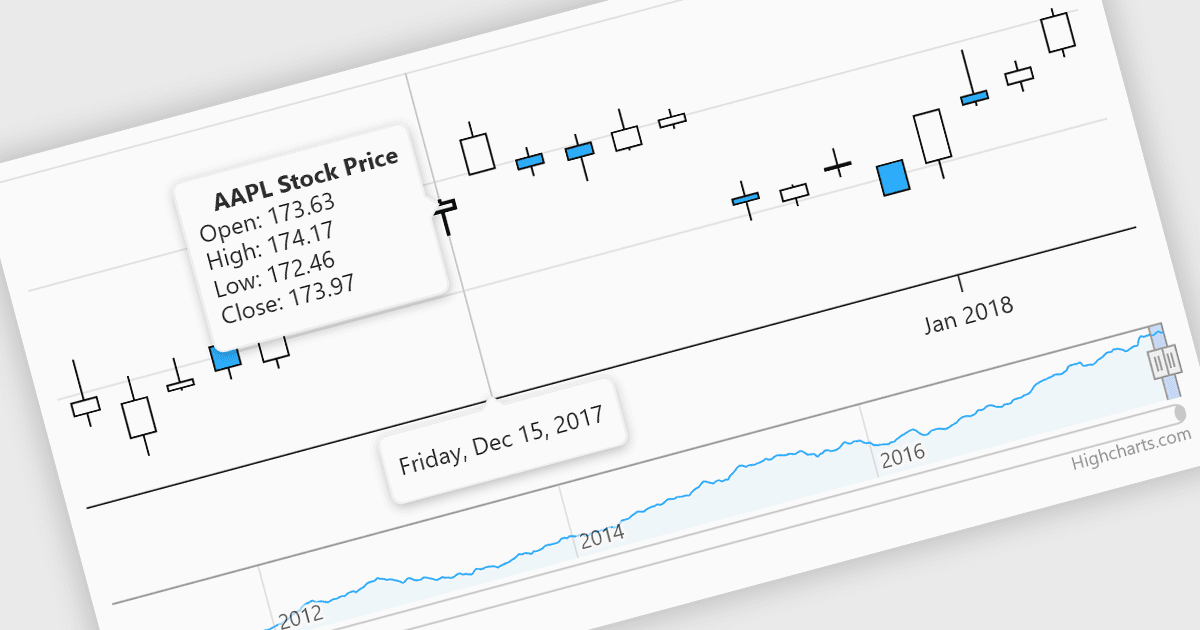
Chart annotations add context directly to data visualizations using labels, markers, shapes, and notes to highlight important information. They make charts easier to interpret by drawing attention to key data points, trends, milestones, targets, or anomalies. Use them to highlight sales peaks, mark significant events, identify performance thresholds, or explain unexpected changes in data.
Several JavaScript chart controls offer chart annotations including:
- Highcharts Core by Highsoft lets you add customizable labels and shapes to emphasize key data points, trends, and areas within charts.
- AnyChart JS allows you to add annotations that provide context, emphasize significant values, and make important chart insights clearer.
- Smart UI Chart for JavaScript by Smart HTML Elements facilitates customizable annotations that add context and draw attention to important chart information.
- Syncfusion JavaScript Charts enables you to annotate chart areas with text, shapes, images, or HTML to communicate additional insights.
For an in-depth analysis of features and price, visit our JavaScript chart controls comparison.