Make Survey Data Easier to Explore
SurveyJS Dashboard v3 adds built-in date filtering with flexible ranges and presets, helping users quickly analyze survey data and uncover trends.
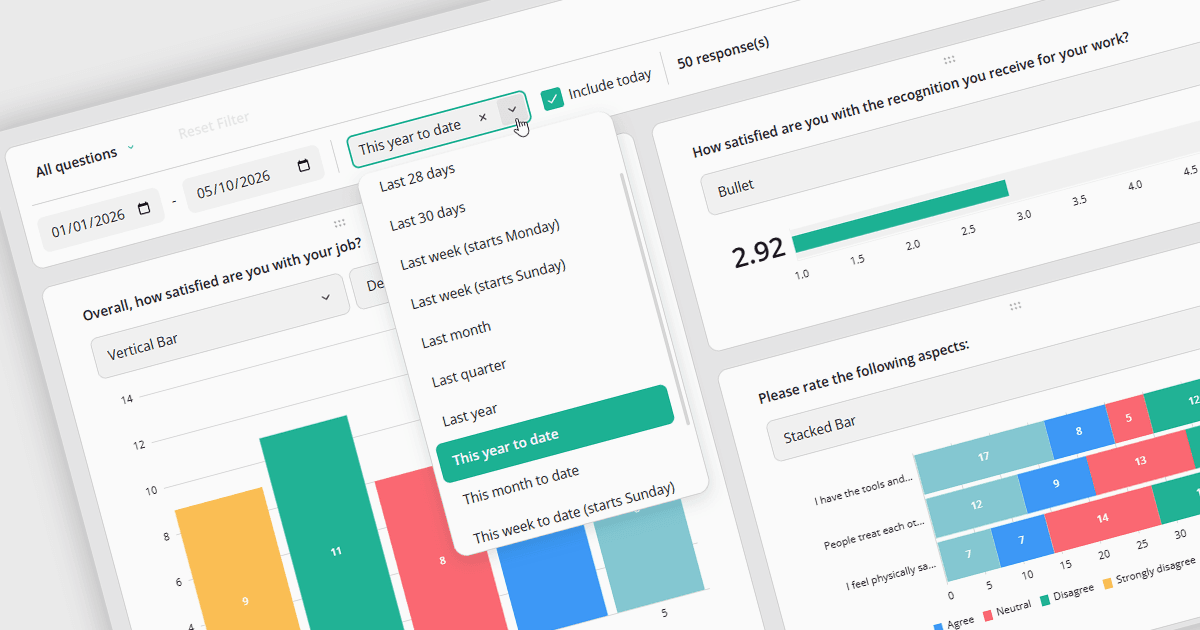
SurveyJS Dashboard is a JavaScript UI component that visualizes survey responses in real time using interactive charts and tables, helping teams analyze data quickly and efficiently. It integrates with any JavaScript framework, including Angular, React, Vue, and vanilla JS. The dashboard renders data based on JSON schemas created in Survey Creator and filled with responses from the Form Library. Its flexible, backend-independent design allows integration with any custom backend. With a variety of chart types, it supports use cases such as customer feedback, employee surveys, and market research by turning raw data into clear visual insights.
The SurveyJS Dashboard v3 update introduces built-in date filtering, giving developers a more efficient way to analyze survey responses across specific time periods. Users can define custom start and end dates or apply predefined ranges such as Last 7 Days, This Month to Date, Last Quarter, and Last Year. This makes it easier to focus visualizations on relevant data, compare periods, and identify trends over time. The control panel also displays the number of responses matching the selected date range, providing immediate context. By integrating date filtering directly into the Dashboard, the update reduces the need for external data preparation or custom filtering logic and enables faster, more focused analysis.
To see a full list of what's new in version 3, see our release notes.
SurveyJS Dashboard is licensed per developer with a one-time payment for indefinite use. Access to updates and technical support is available through a subscription. See our SurveyJS Dashboard licensing page for full details.
Learn more on our SurveyJS Dashboard product page.