Use Maps to Visualize Geographic Data
Gain visual insights from location-based information by adding map functionality to your JavaScript applications.
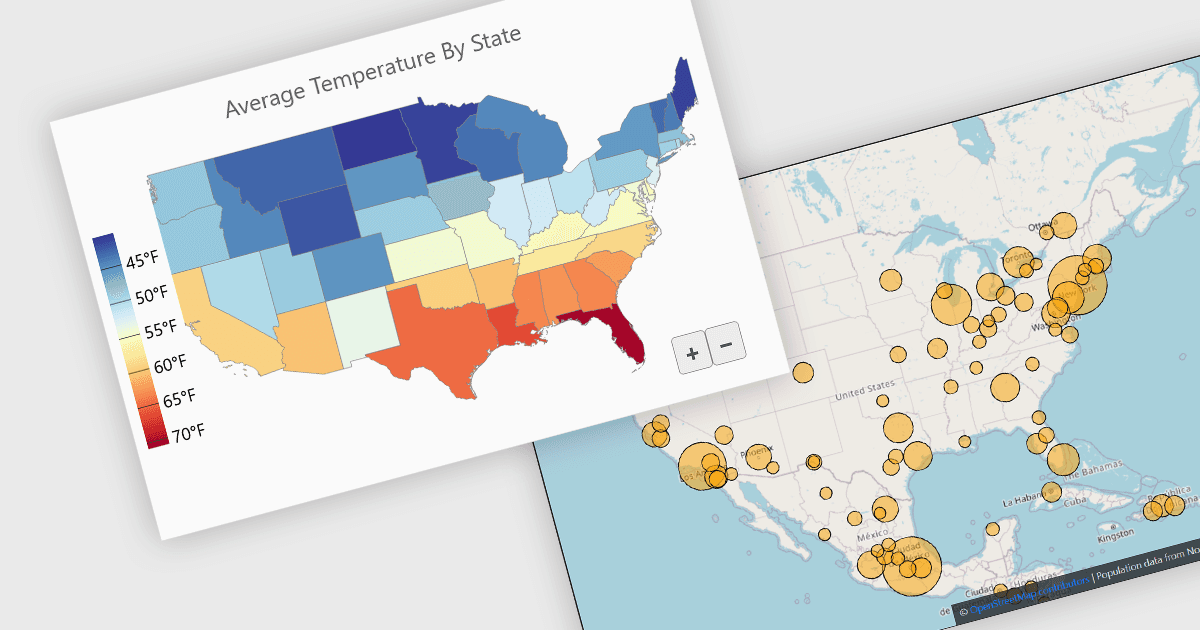
Map software components provide developers with prebuilt functionality for adding interactive geographic views and location-based data visualization to applications. They can reduce the development effort required to implement capabilities such as markers, geographic data layers, zooming and navigation, while helping teams create consistent, responsive mapping experiences that make spatial information easier to explore and understand.
Several JavaScript UI suites offer you map components, including:
- DevExtreme Complete by DevExpress provides interactive mapping for web applications, with support for multiple map providers, markers, routes and configurable map types.
- Wijmo by MESCIUS provides FlexMap for creating GeoJSON-based bubble, scatter and choropleth maps, with customizable palettes, data binding and support for major JavaScript frameworks.
- Kendo UI by Telerik provides interactive Map components with tile and shape layers, GeoJSON data, markers, tooltips, bubble layers and touch-based navigation.
- Sencha Ext JS provides Google Maps integration for incorporating interactive maps into applications, with support for location markers and configurable mapping options.
For an in-depth analysis of features and price, visit our comparison of JavaScript UI suites.