Build Report Visualizations Faster with AI Assistance
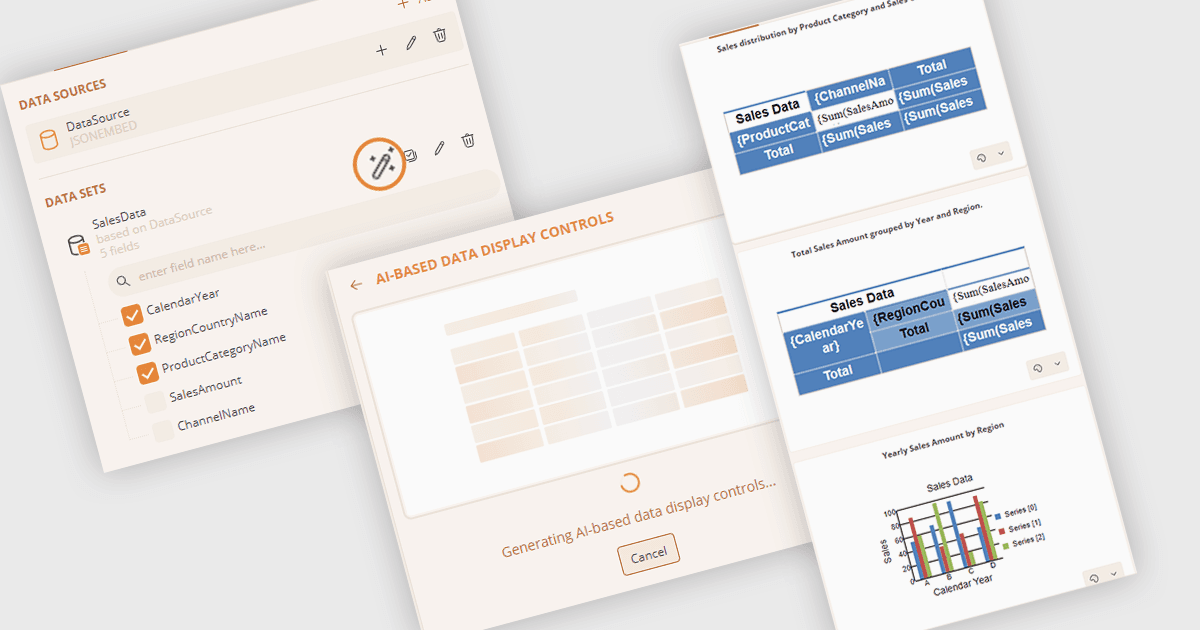
ActiveReportsJS V6.2 introduces an AI Assistant that helps report authors generate table, tablix, and chart visualizations from dataset structures.
ActiveReportsJS by MESCIUS is a JavaScript reporting toolkit that allows developers to design and embed interactive reports within web applications. It includes a standalone report designer for building reports visually and a JavaScript report viewer component that integrates with web frameworks such as React or vanilla JavaScript. The toolkit supports a range of data visualization options and export formats, helping developers deliver rich, interactive reporting capabilities in the browser.
The ActiveReportsJS V6.2 release extends the Report Designer's Explore feature, allowing report authors to generate table, tablix, and chart visualizations using AI. When configured, the designer sends dataset field names and types, rather than the underlying data, to the selected AI provider and presents the resulting visualizations as cards with descriptions. This can reduce the manual work involved in selecting and configuring suitable data visualizations.
To see a full list of what's new in 6.2, see our release notes.
ActiveReportsJS is licensed on an annual subscription or perpetual basis and is available as a Single Deployment License for non-commercial use, and as a Single Domain License or Unlimited Domain License for commercial and/or SaaS use. See our ActiveReportsJS licensing page for full details.
Learn more on our ActiveReportsJS product page.