Show Data Trends at a Glance
Add compact sparklines to charts, grids, and dashboards to help users quickly identify trends and changes without taking up valuable space.
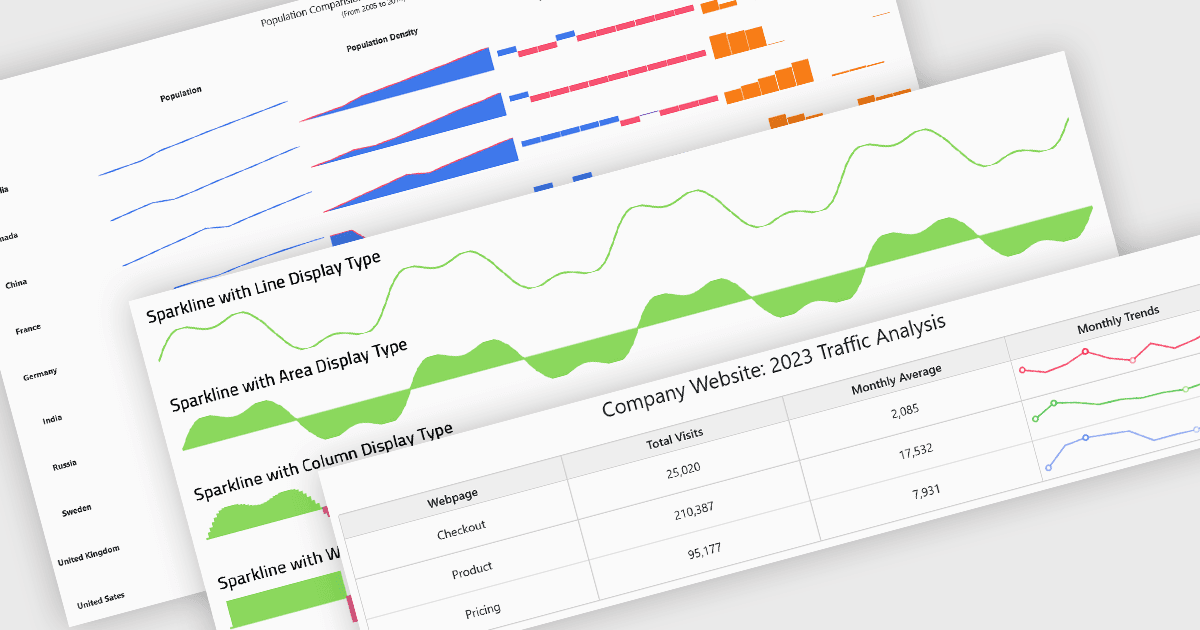
Sparklines are compact, data-rich charts designed to show trends, patterns and variations without the space required by a conventional chart. Often embedded within tables, grids or dashboards, they provide an at-a-glance view of changes across a series of values, helping users identify movements and exceptions while keeping the surrounding interface concise.
Several Blazor chart controls offer sparklines including:
- DevExpress Blazor Charts provides a dedicated Sparkline component that can be used independently or embedded in other controls, with eight series types including line, spline, area, bar and win/loss, alongside tooltips and configurable point highlighting.
- Syncfusion Blazor Charts includes a dedicated Sparkline component for displaying trends in small areas, with configurable series and axis types plus markers, data labels and range bands.
- Infragistics Ignite UI for Blazor Chart provides a lightweight Sparkline component supporting line, area, column and win/loss displays, with options for markers, normal ranges, trendlines, unknown-value handling and tooltips, and it can be embedded within data grids.
- TeeChart .NET for Blazor by Steema Software offers an extensive selection of standard, financial, statistical and extended series that developers can configure as compact visualizations, with customizable visual attributes and Scalable Vector Graphics (SVG) and static-image rendering options.
For an in-depth analysis of features and price, visit our Blazor chart controls comparison.