Add Context to Charts with Annotations
Highlight significant values, explain unusual results and mark reference ranges directly within your .NET WinForms charts.
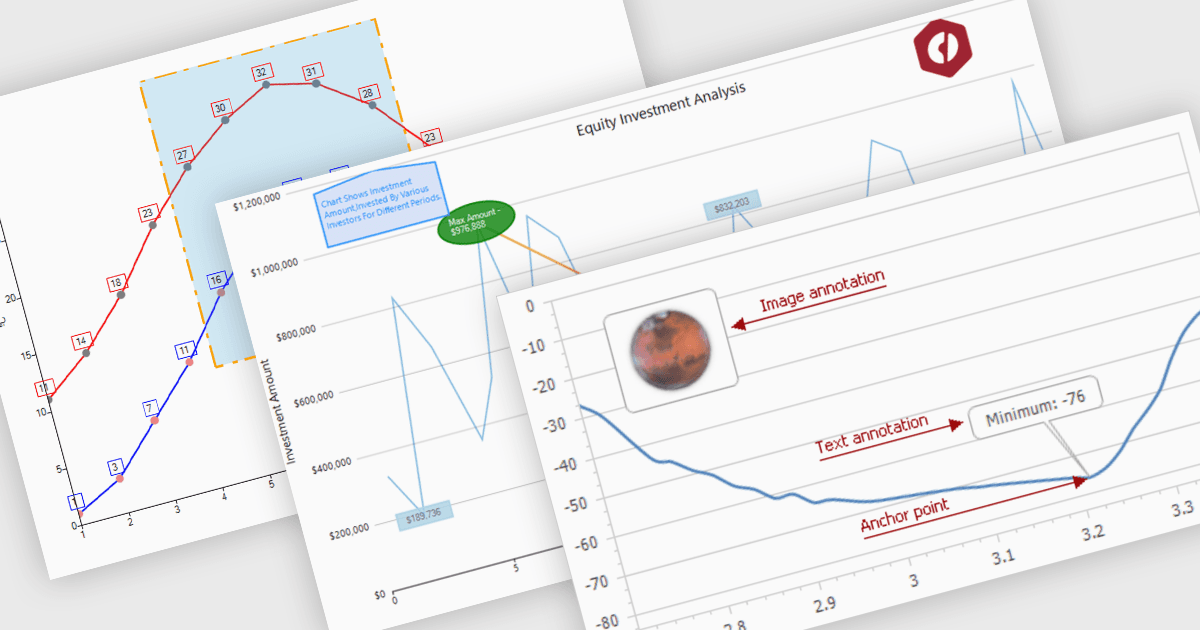
Annotation support in a .NET WinForms chart lets developers add explanatory text, images, lines or shaded regions alongside plotted data. These elements help users understand why a value matters without referring to separate notes or changing the underlying dataset. Developers can use annotations to identify a production fault, explain a sales decline or mark an acceptable operating range, making charts easier to interpret within desktop applications.
Several .NET WinForms chart controls support annotations, including:
- DevExpress WinForms Charts lets you anchor text and image annotations to charts, panes or individual series points, with options for users to add annotations at runtime.
- ComponentOne WinForms Charts by MESCIUS allows you to add annotation callouts with line or arrow connectors, linking explanatory text to specific data points.
- Telerik UI for WinForms ChartView provides grid line, plot band and marked zone annotations to identify significant values and highlight areas of interest.
- LightningChart .NET supports configurable text annotations and arrow targets positioned using axis coordinates, with options for dragging, resizing and rotation.
For an in-depth analysis of features and price, visit our comparison of .NET WinForms chart controls.