Keep Stacked Chart Labels Readable
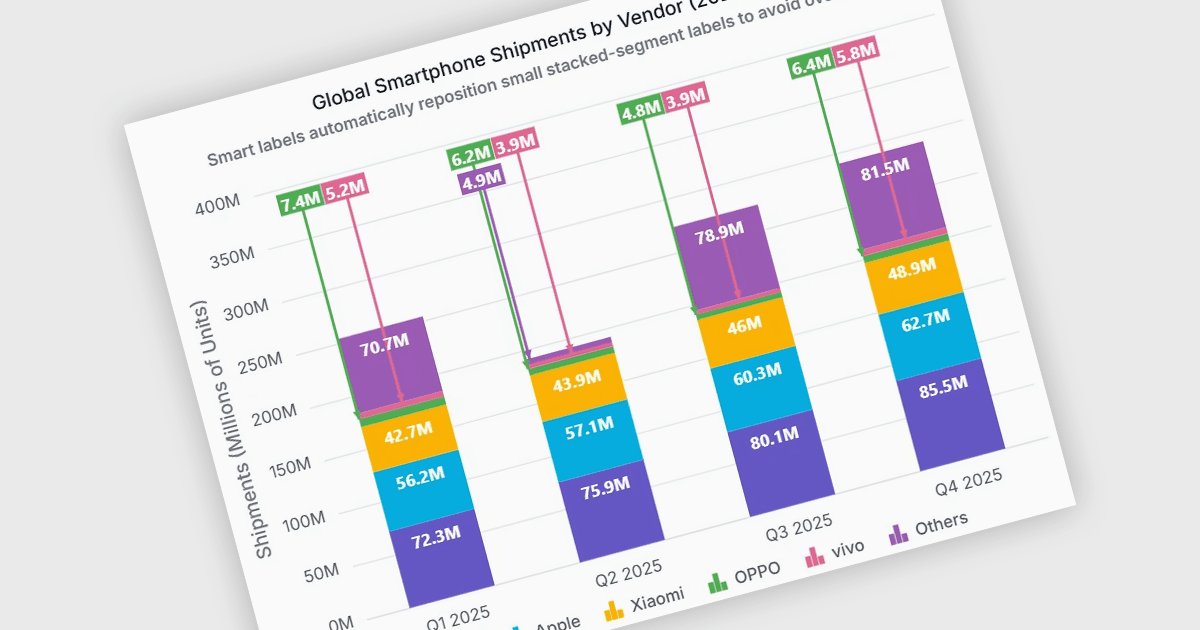
Syncfusion Chart SDK 2026 Volume 3 (35.1.37) repositions overlapping stacked column labels while keeping them linked to their data points.
Syncfusion Chart SDK provides components for adding interactive charts, gauges, maps, and other data visualizations to applications. Developers can present business and analytical data using multiple chart types, configurable axes, annotations, and data exploration features.
Syncfusion Chart SDK 2026 Volume 3 (35.1.37) introduces smart data labels for stacked column charts in its Web Charts and Web 3D Charts components. The chart automatically detects overlapping labels and moves them to readable positions, using connector lines to show which data points they represent, helping developer display values clearly when stacked segments leave limited space for labels. This enhancement is supported for the React, Angular, JavaScript, TypeScript, Vue, ASP.NET Core, and ASP.NET MVC platforms.
For a full list of what's new in 2026 Volume 3 (35.1.37), see our release notes.
Syncfusion Chart SDK is licensed per developer through timed annual subscriptions which include support and maintenance, and must be renewed to continue using the software. See our Syncfusion Chart SDK licensing page for full details.
Learn more on our Syncfusion Chart SDK product page.