Turn Data into Dashboards with Drag-and-Drop Tools
Dashtera enables users to build interactive dashboards without coding, using drag-and-drop chart placement, automatic layouts and flexible data connections.
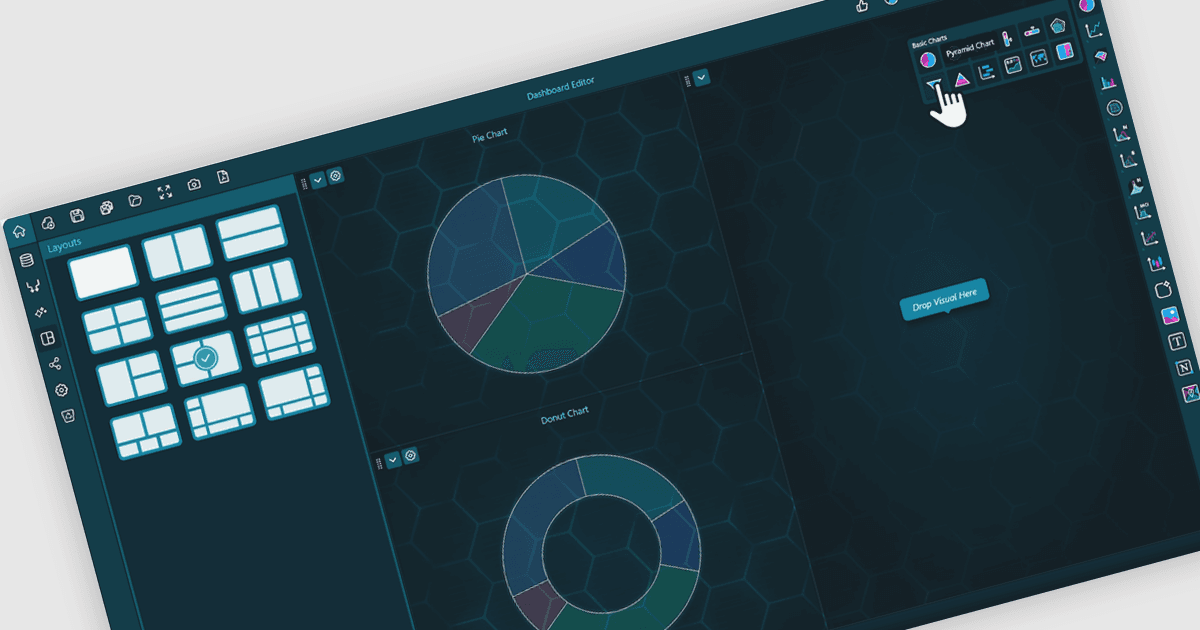
Dashtera is a data analytics and dashboarding platform that enables users to visualize and explore data without programming. It supports connections to SQL databases, streaming sources and external services, alongside file imports, for business intelligence, engineering, scientific and financial analysis.
The dashboard editor allows users to select charts from the Visuals Toolbar and drag them into position. Charts dock alongside existing visualizations, automatically splitting the available space horizontally or vertically to create responsive layouts without manually specifying chart sizes or docking attributes. Users can explore data with zooming and data cursors while editing, then share completed dashboards with viewers. This visual workflow enables teams to create and adapt dashboards without writing custom visualization code.
Dashtera is licensed through Business Intelligence, Engineering & Science, and Finance & Trading plans, with annual per-user pricing. See our Dashtera licensing page for full details.
To find out more, visit our Dashtera product page.