Show Data Trends Within WPF Grids
Embed sparklines in grid cells to help users compare patterns and spot changes alongside the corresponding data.
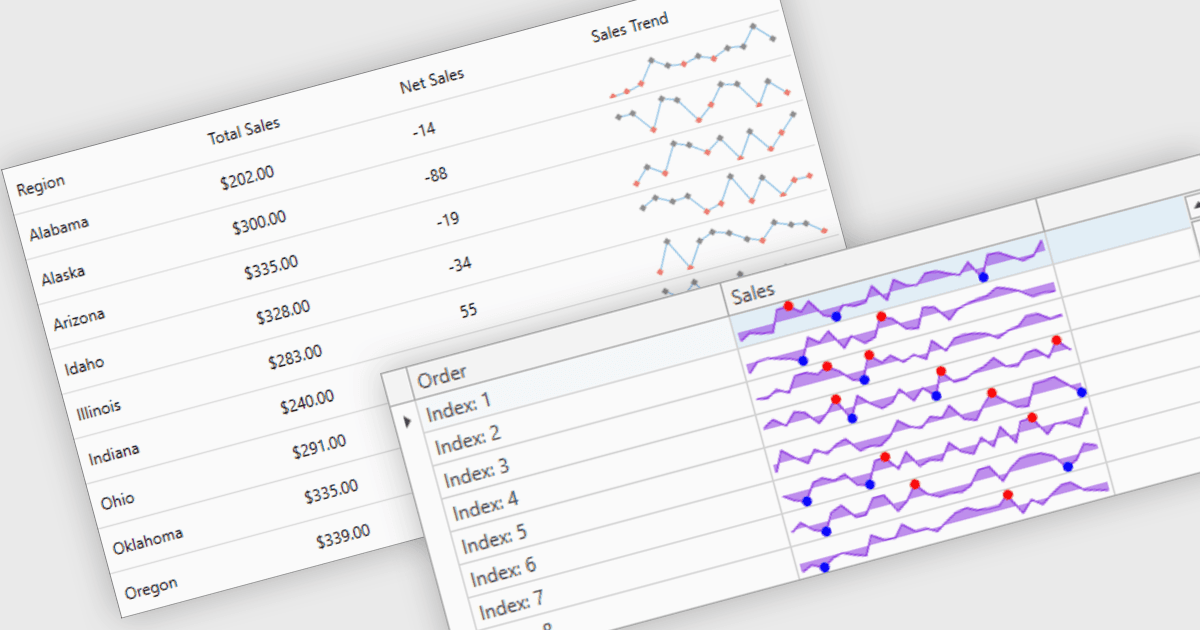
Sparklines give WPF grids a compact way to display a series of values within a single cell. A sales grid can show monthly performance beside each region's total, while an investment table can display price movements alongside current holdings. Keeping these visual summaries within each row helps users distinguish steady growth, fluctuations and declines without opening a separate chart. Developers can use different sparkline styles and highlight key points to make relevant changes easier to identify.
Several WPF grid components support sparklines, including:
- DevExpress WPF Data Grid displays area, line, bar and win/loss sparklines in grid columns, with options to highlight minimum and maximum values.
- ComponentOne WPF FlexGrid by MESCIUS embeds its sparkline control through cell templates, supporting line, column and win/loss displays with configurable markers and styling.
- Telerik UI for WPF DataGrid integrates with RadSparklines to display trends within grid rows, including financial dashboards with frequently updated data.
- Syncfusion WPF DataGrid embeds line, area, column and win-loss sparklines through cell templates, helping users compare trends alongside each record's values.
For an in-depth analysis of features and price, visit our comparison of WPF grid components.