Display Key Metrics with Angular Gauges
Add gauges to Angular dashboards so users can assess current values against defined ranges and thresholds.
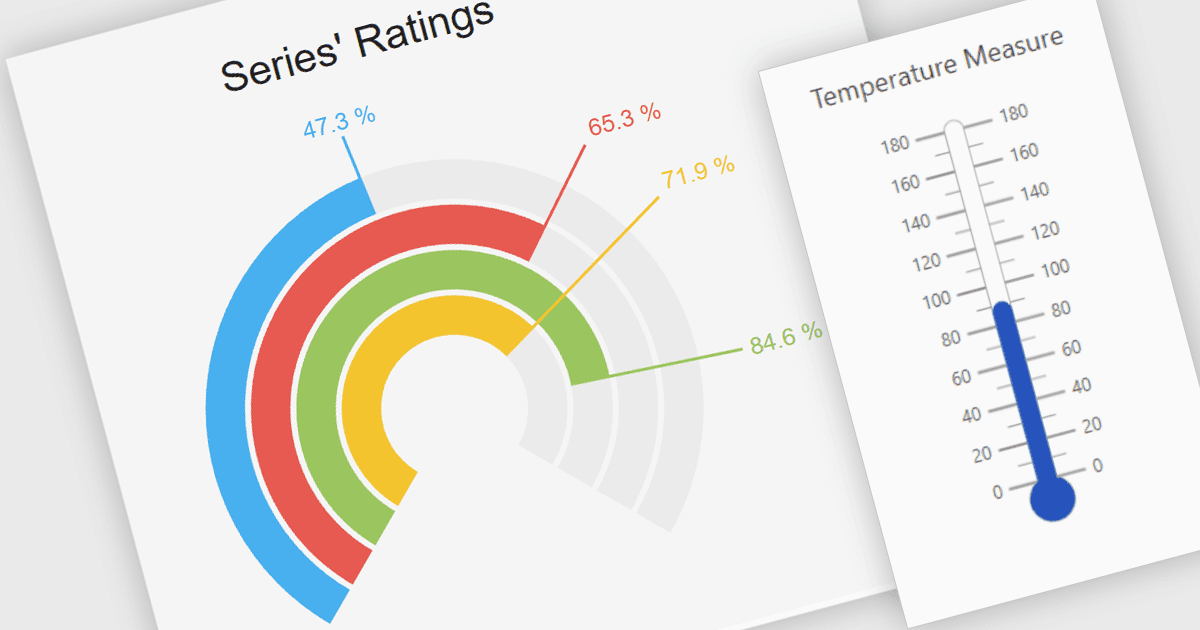
Gauge controls show where a measurement falls within a scale, helping users assess operational status without working through a table of figures. In Angular applications, developers can use gauges to display equipment temperatures, capacity usage or progress toward a target. Colored ranges distinguish normal values from warning levels, while pointers and labels identify the current reading. Including gauges within a UI suite also lets developers combine these displays with grids, charts and input controls in the same dashboard.
Several UI & Visualization Suites include Angular gauge controls, including:
- DevExtreme Complete by DevExpress provides circular gauges with configurable scales, colored ranges and a choice of value indicators, including needles and range bars.
- Kendo UI by Telerik includes arc, circular, linear and radial gauges, with customizable scales, labels and ticks, plus image, PDF and SVG export.
- Syncfusion Essential Studio UI Component Suite includes circular gauges with multiple axes, colored ranges and needle, marker or range-bar pointers for displaying measurements.
- Infragistics Ignite UI provides radial gauges with configurable needles, tick marks, labels and comparative ranges, along with animated transitions between values.
For an in-depth analysis of features and price, visit our comparison of Angular UI & Visualization Suites.