Speed Up Rendering of Custom-Colored Line Charts
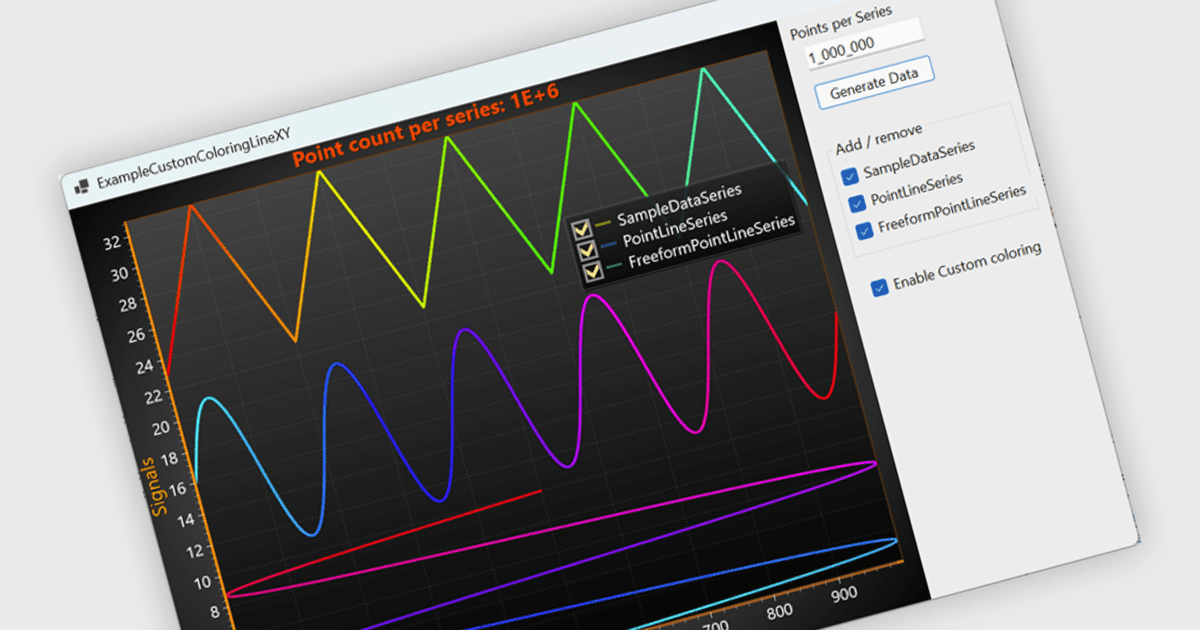
LightningChart .NET improves custom-colored line performance, enabling faster and more responsive visualization of large datasets.
LightningChart .NET is a high-performance data visualization library designed for .NET developers working with WPF, WinForms, and UWP applications. It offers GPU-accelerated rendering for smooth real-time visualization of massive datasets, exceeding billions of data points. This library supports a wide variety of chart types, including 2D, 3D, polar, and geographic maps, along with extensive customization options for each. LightningChart .NET is a powerful tool for developers creating demanding data visualization applications requiring exceptional performance.
The latest LightningChart .NET update makes it more efficient for developers to visualize large, complex line series with individual point colors, delivering rendering speeds up to 100 times faster for high-volume datasets. Direct access to original point indices reduces the need for additional lookup operations and lowers processing overhead. The update also supports these color customizations in SVG and EMF exports, helping preserve visual detail across on-screen and vector output.
LightningChart .NET is available per developer in packages for either WPF, WinForms, UWP or all 3. Each package comes as a subscription license (with 1 or 2 years of limited support), or a perpetual license (with 1 or 2 years of Standard or Premium support). Floating licenses and site licenses are available upon request. See our LightningChart .NET licensing page for full details.
Learn more on our LightningChart .NET product page.