Provide Reports with Geographic Context
Compare regional data and reveal geographic patterns in business activity by adding maps to your reports in ASP.NET Core.
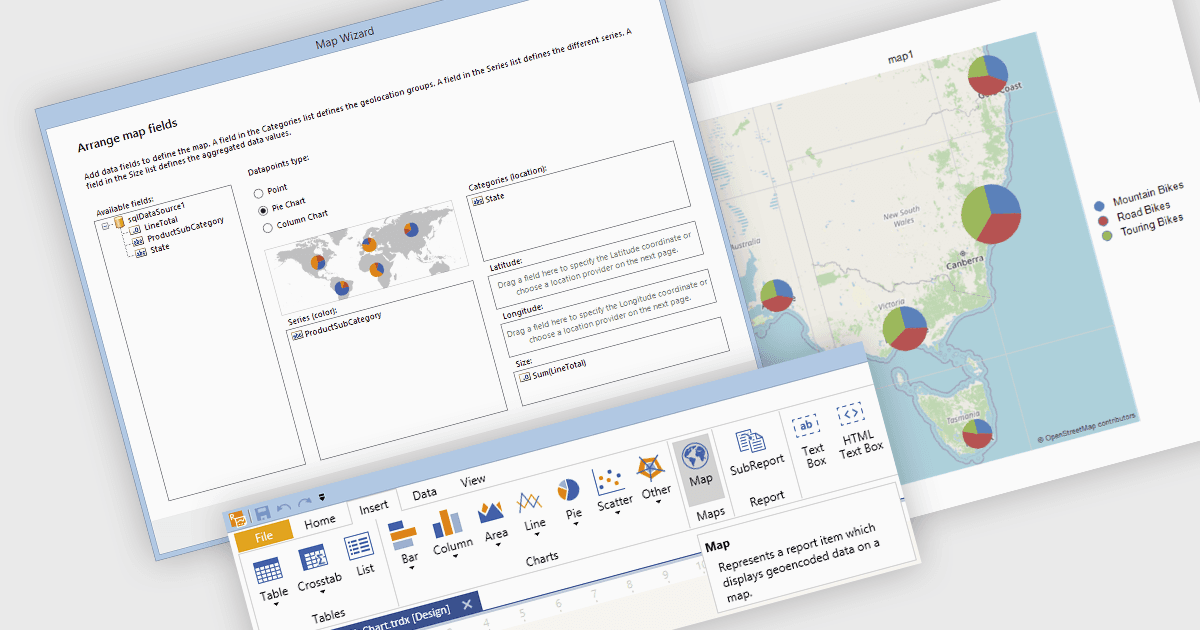
Using maps in reports connects business values with geographic areas or individual locations, helping readers identify regional trends, compare performance across territories, and uncover patterns that may be overlooked in tables or charts. Color shading, markers, and map-based charts can display multiple datasets alongside supporting tables and summaries, making geographic relationships easier to interpret. Common uses include analyzing regional sales, identifying customer concentrations, assessing service coverage, monitoring delivery logistics, and planning resource allocation. By showing where activity is concentrated, performance differs, or opportunities emerge, maps help readers communicate findings clearly and make more informed decisions.
Several ASP.NET Core reporting components support maps, including:
- ActiveReports.NET Professional by MESCIUS provides a Map report control with layers and color scales for presenting geographic data in Page and RDLX reports.
- Telerik Reporting supports point, pie, column, and choropleth maps, allowing report authors to choose how values are represented across individual locations and regions.
- List & Label Enterprise Reporting Edition by combit supports shapefile-based maps that link report data to geographic regions for comparing values across territories.
- Stimulsoft Reports.WEB includes a Map report component for presenting regional data and comparing values, with support for integrating reports into ASP.NET Core applications.
For an in-depth analysis of features and price, visit our comparison of ASP.NET Core reporting components.