Compare Data Trends Within .NET Grids
Display sparklines alongside grid values to help users compare historical patterns and identify changes without opening separate charts.
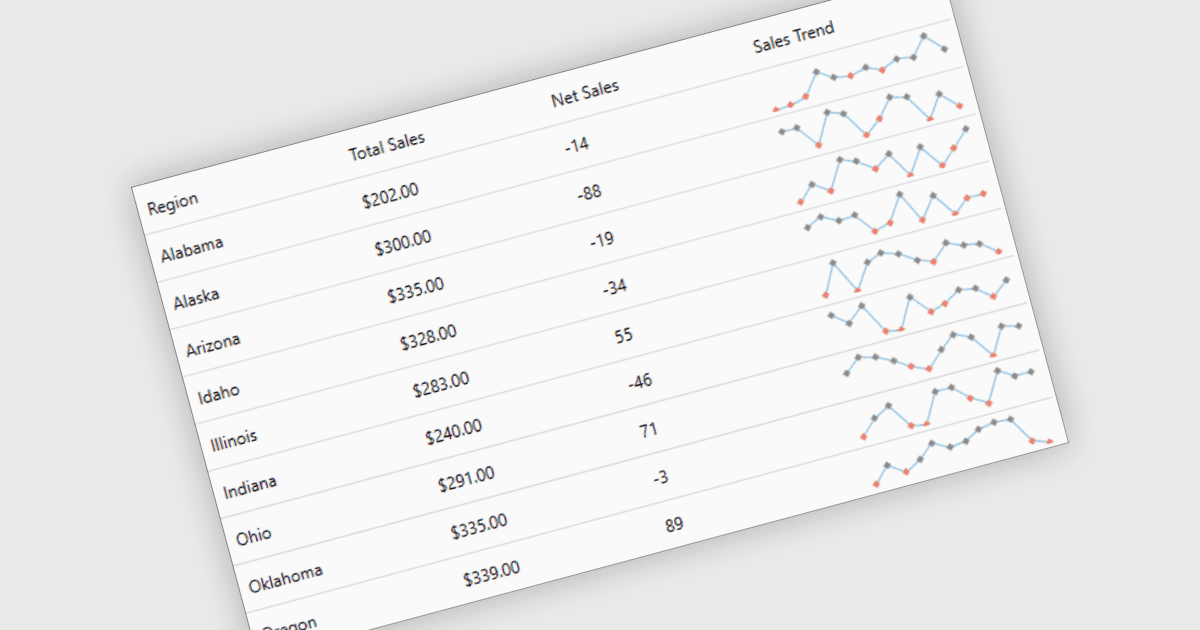
Sparklines summarize a series of values within a grid cell, adding context that a single figure cannot provide. Two products may have similar sales totals but very different patterns of growth and decline. Showing these patterns beside each record helps users distinguish consistent performance from seasonal variation or sudden changes. In .NET applications, developers can use sparklines to present sales histories, payment activity or operational measurements while keeping the detail and its visual summary together.
Several .NET grid components support sparklines, including:
- DevExpress WinForms Data Grid displays line, area, bar and win/loss sparklines within cells, with options to highlight first, last, minimum and maximum values.
- ComponentOne WPF FlexGrid by MESCIUS uses cell templates to display sparklines beside row data, including sales trends with markers and distinct colors for negative values.
- Syncfusion Blazor DataGrid embeds Sparkline components through column templates, allowing developers to display a separate series of values for each record.
- Telerik UI for WinForms GridView provides a dedicated sparkline column supporting line, area, bar, scatter and win/loss series.
For an in-depth analysis of features and price, visit our .NET grid controls comparison.