Explain Key Values with Annotations in Angular Charts
Place notes, labels, and other visual cues on charts to explain significant events and unusual results.
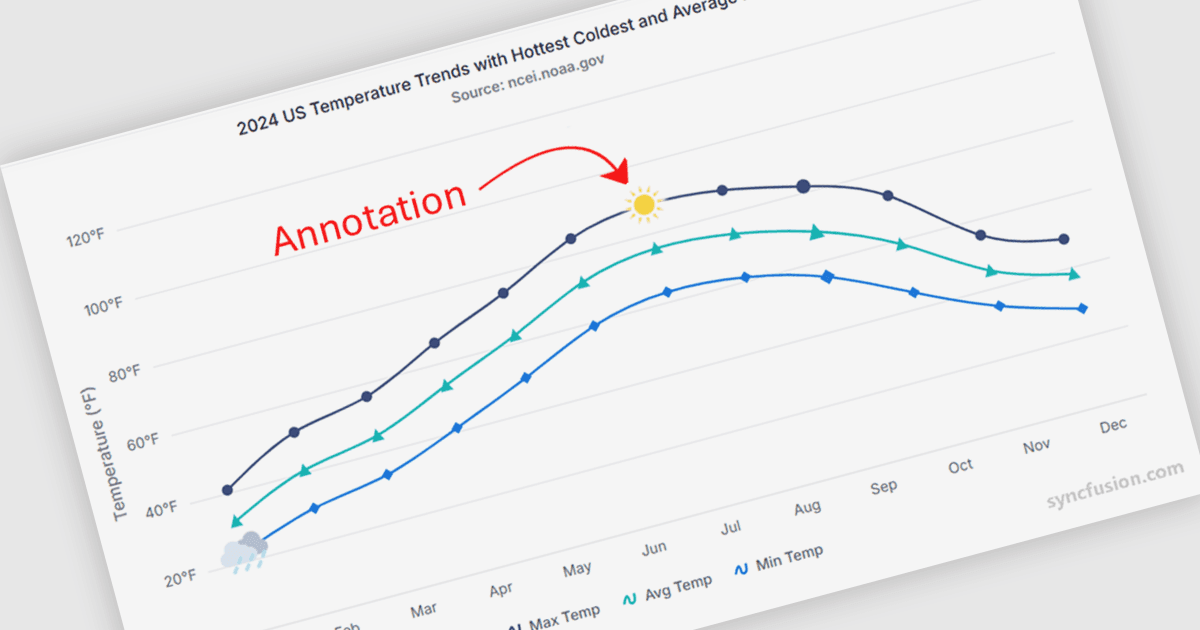
Chart annotations add explanatory content alongside the data it describes. In Angular applications, developers can use them to explain a sudden sales increase, identify a milestone, or draw attention to an unexpected measurement. Attaching context to a chart point or area helps readers understand why a value matters without searching through separate notes. Depending on the component, annotations can contain text, shapes, images, or HTML content.
Several Angular chart components support annotations, including:
- Wijmo Angular Chart (FlexChart) by MESCIUS supports editable annotations, allowing users to add context to chart data and adjust annotations interactively.
- DevExtreme Angular Chart by DevExpress supports text and image annotations, with positioning and appearance settings for highlighting chart information.
- Highcharts Core by Highsoft provides an annotations module for adding configurable labels and shapes to charts used in Angular applications.
- Syncfusion Angular Charts supports annotations containing text, shapes, images, and custom HTML elements to highlight values and explain chart details.
For an in-depth analysis of features and price, visit our Angular chart controls comparison.