Locate Performance Bottlenecks
Use profiling tools in IDEs to measure execution costs and focus development effort on the code that needs attention.
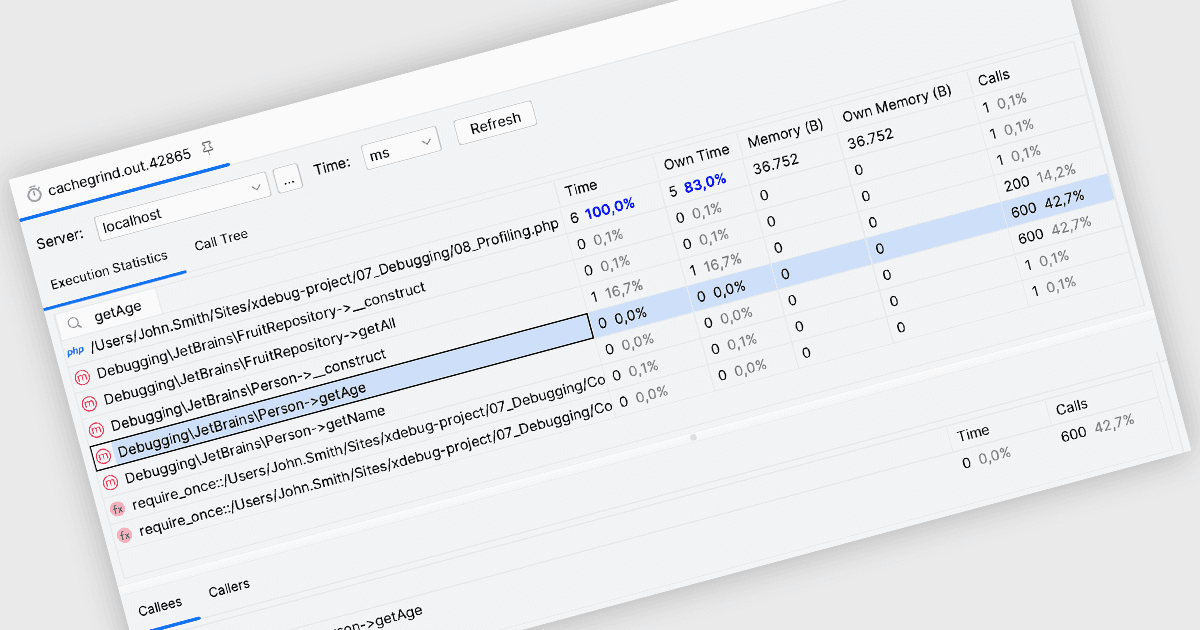
A slow operation can involve many functions, making its underlying cause difficult to identify from source code alone. Profiling records how an application behaves while it runs, helping developers investigate expensive calls, repeated work and excessive resource consumption. Examining these measurements within an IDE makes it easier to connect performance problems with the relevant code. Developers can then make targeted changes and repeat the same workload to assess whether those changes improved performance.
Several IDEs support profiling, including:
- PhpStorm by JetBrains analyzes Xdebug snapshots through execution statistics, call trees, callers and callees, showing function timings, memory consumption and call counts.
- PrimalScript by SAPIEN Technologies displays CPU and memory usage for scripts run within the IDE, helping developers monitor resource consumption and investigate performance issues.
- Microsoft Visual Studio provides CPU Usage profiling with function timings, call trees and caller/callee views to help developers trace costly execution paths.
For an in-depth analysis of features and price, visit our IDEs comparison.