在您的 Blazor 应用中管理项目
为用户提供甘特图,提供对项目时间线、依赖关系和进度的清晰且简明概览。
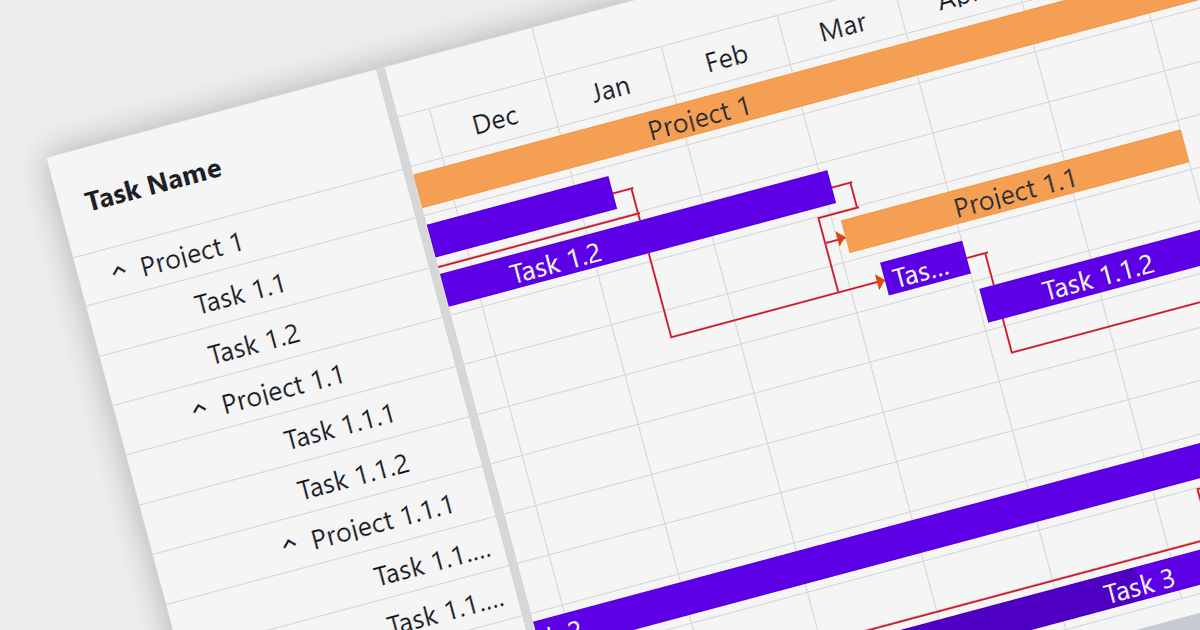
甘特图是一种条形图,用于说明项目进度安排。它们会展示项目中不同元素的开始日期和结束日期,是项目管理中必不可少的工具。这些图表通过显示项目任务如何重叠以及彼此之间的关系,便于跟踪项目进展并进行规划。
多种 Blazor 图表组件提供甘特图,包括:
- ComponentOne Charts for Blazor(MESCIUS 的 ComponentOne Studio Blazor Edition 组成部分)为 Blazor 应用提供强大且可自定义的甘特图。
- Telerik Blazor Chart(Telerik UI for Blazor 组成部分)提供功能丰富的甘特图,并支持交互式数据可视化。
- Syncfusion Blazor Chart(Syncfusion Essential Studio Enterprise 组成部分)配备全面的甘特图,并提供原生 Blazor 支持。
- Smart HTML Elements Blazor Chart(Smart HTML Elements 组成部分)为创建现代 Blazor UI 提供易于使用的甘特图。
- TeeChart Blazor(Steema Software 的 by TeeChart .NET for Blazor 组成部分)包含功能多样的甘特图,并提供广泛的自定义选项。
如需深入了解功能与价格,请访问我们的 Blazor Charts 对比。