揭示多个变量之间的关系
散点图/气泡图可帮助你同时洞察三种因素中的趋势、比较幅度,并识别聚类。
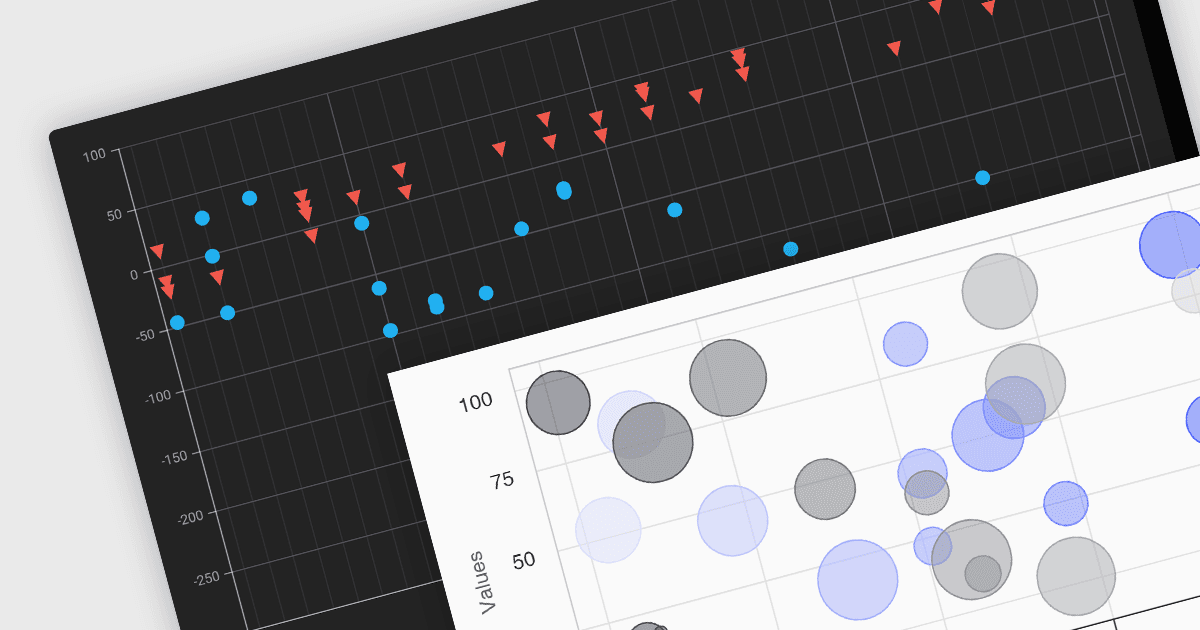
散点图和气泡图用于在二维图表上展示数据点。虽然散点图使用点来表示数据点,但气泡图通过改变点的大小增加了一个额外维度,通常用来表示体积或强度。这些图表有助于展示变量之间的关系,并识别数据中的模式或趋势。
一些 Angular 图表控件提供散点图和气泡图,包括:
- Highcharts Core 让你能够借助详细的自定义选项和动态动画,打造交互式的曲面图和气泡图。
- DevExtreme Chart(属于 DevExpress 的 DevExtreme Complete)将响应式的曲面图和气泡图集成到你的 Angular 应用中,并提供自定义主题。
- Kendo UI for Angular Chart(属于 Telerik 的 Kendo UI)使你能够为 Angular 项目添加具备高级数据绑定的动态曲面图和气泡图。
- amCharts 5: Charts 在引人入胜的曲面图和气泡图中可视化多维数据,提供丰富的交互能力和钻取选项。
想深入了解功能与价格,请访问我们的 Angular 图表控件对比。