在图表数据中描绘并预测趋势
趋势线有助于辨识图表数据中的规律,并预测未来的走势,从而在各个领域支持决策制定。
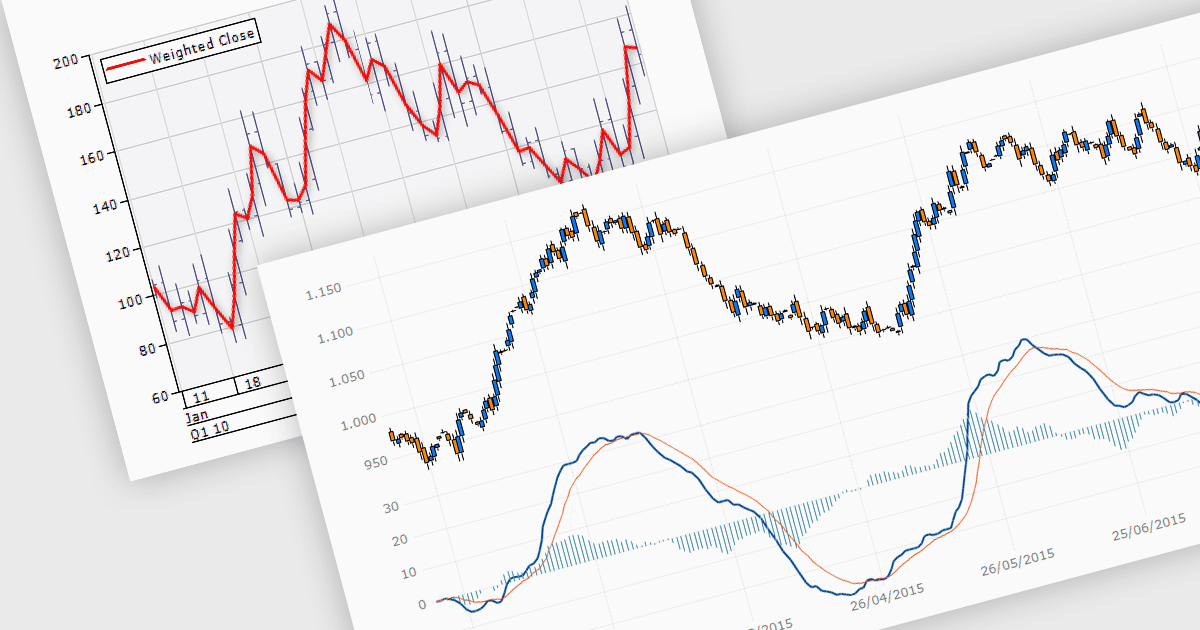
趋势线是数据可视化和金融分析中必不可少的工具,用于识别并解读数据集中的趋势方向与强度。趋势线是一条在图表上最能代表数据的线,用于突出在特定期间内的整体走向。它有助于做出明智的决策、预测未来的价格走势,并验证正在进行的趋势强度。在股票市场分析中,趋势线可以帮助投资者确定最佳的进场与出场时机;同时,移动平均线能够发出买入或卖出机会的信号,从而提升交易策略的有效性。
一些 .NET WinForms 图表控件提供趋势线和指标,包括:
- DevExpress WinForms Chart(DevExpress WinForms 的一部分)通过可自定义的趋势线实现精确的趋势分析,从而增强数据解读能力。
- ComponentOne Charts for WinForms(MESCIUS 的 ComponentOne Studio WinForms Edition 的一部分)提供强大的趋势线功能,用于简化分析流程。
- Nevron Chart for WinForms(Nevron Chart for .NET 的一部分)提供先进的趋势线功能,非常适合进行精细的预测。
- TeeChart WinForms(Steema Software 的 TeeChart for .NET)便于使用多条趋势线,从而提高图表中数据趋势的准确性与清晰度。
- Infragistics Windows Forms Charts(Infragistics Professional 的一部分)让你能够融入复杂的趋势线,使复杂数据更易于分析。
如需更深入地了解功能与价格,请访问我们对 .NET WinForms 图表控件的比较。