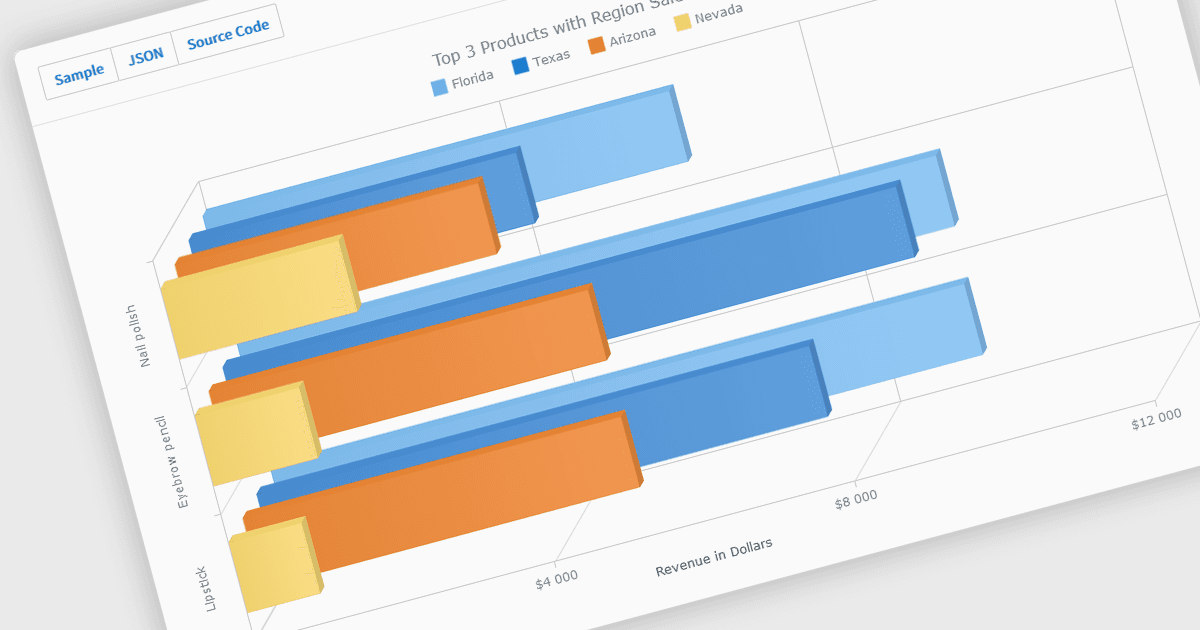
用 3D 图表创建更多动态演示文稿

6月 19, 2024
支持 3D 的 jQuery 图表控件提供了更具吸引力的数据描述,并提供缩放和平移等交互式功能。

继续用英语阅读:

A selection of jQuery chart controls offer 3D capabilities, allowing data visualization to extend beyond the flat plane. This enables a more immersive and engaging user experience, particularly for complex datasets. Three-dimensional charts can be beneficial for highlighting patterns and relationships between multiple variables, making them ideal for scientific visualizations, financial data representation, or showcasing product features in a unique way.

Several jQuery chart controls offer 3D charts including:

  • Highcharts Core by Highsoft lets you create interactive 3D charts with extensive customization options, delivering dynamic data visualizations for web applications.
  • FusionCharts Suite XT allows you to build stunning 3D charts, offering a broad selection of chart types and rich animation effects.
  • AnyChart JS lets you design versatile 3D charts, providing a wide range of features and seamless integration into web applications.
  • TeeChart JS by Steema Software enables the design of sophisticated 3D charts, offering high performance and versatile charting solutions for developers.
  • ZoomCharts provides interactive 3D charting capabilities, ensuring smooth and responsive visual data exploration with intuitive user interfaces.

For an in-depth analysis of features and price, visit our comparison of jQuery chart controls.

Compare jQuery Chart Controls