在你的数据中展示趋势或模式
使用折线图以可视化方式呈现不断演变的数据点,从而直观理解数值在特定时间段内如何变化。
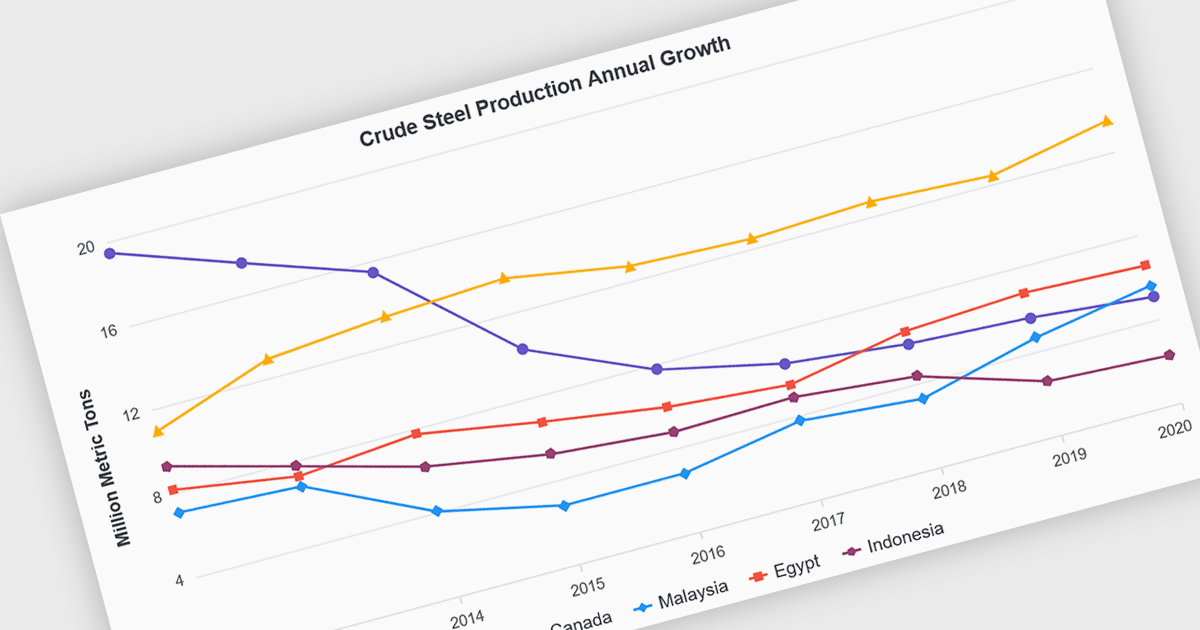
折线图是将数据点通过线条连接起来的可视化表示,通常用于展示随时间变化的趋势、模式或变化。它们特别适合展示连续数据集,例如股票价格、温度波动或销售数据。通过连接数据点,折线图能清晰直观地帮助理解数值在特定时间段内如何演变。这种可视化表示有助于识别趋势、进行对比,并预测未来结果。
以下多种 Blazor 图表控件提供折线图功能,包括:
- DevExpress Blazor Chart(属于 DevExpress ASP.NET 和 Blazor)让你能够为数据可视化创建可自定义的折线图。
- ComponentOne Charts for Blazor(属于 MESCIUS 的 ComponentOne Blazor Edition)可让你轻松设计交互式折线图。
- Telerik Blazor Chart(属于 Telerik UI for Blazor)便于创建视觉效果出众的折线图,并提供多种自定义选项。
- Syncfusion Blazor Chart(属于 Syncfusion Essential Studio Enterprise)为 Blazor 应用程序提供高性能折线图组件。
如需深入了解功能和价格,请访问我们的 Blazor 图表控件对比。