用动态饼图提升你的 React 应用
使用直观的饼图,让数据可视化更清晰、更有影响力,从而获得准确且易于理解的数据洞察。
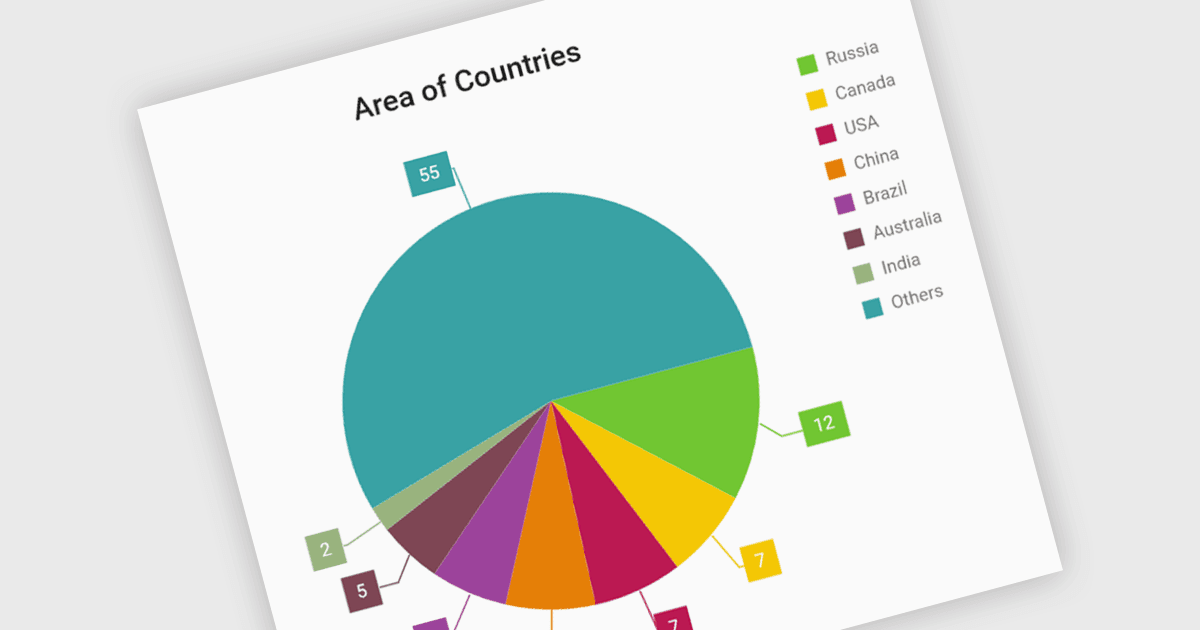
饼图是圆形图表,可将数据以“整体切片”的形式直观呈现。每个切片代表一个类别,其大小与该类别在总量中的占比成正比。饼图特别适合用于展示分类数据,例如市场份额、人口统计或预算分配。饼图提供清晰且直观的相对数量对比方式,使你能够轻松识别占主导地位的类别及其对整体构成的贡献。
一些 React 图表控件提供饼图,包括:
- Highcharts Core(Highsoft)支持你创建可交互的饼图,并可自定义选项,包括数据标签、工具提示和动画效果。
- DevExtreme Chart(DevExpress 的 DevExtreme Complete 一部分)提供带主题与自定义选项的饼图,并可与其他图表及数据源集成。
- KendoReact Chart(Telerik 的 KendoReact 一部分)提供支持数据绑定、动画和事件处理的饼图,让你能够轻松将其集成到 React 应用中。
- LightningChart JS可为复杂数据可视化提供高性能饼图,适用于大型数据集和要求更高的应用场景。
如需深入了解功能与价格,请访问我们的 React 图表控件比较。