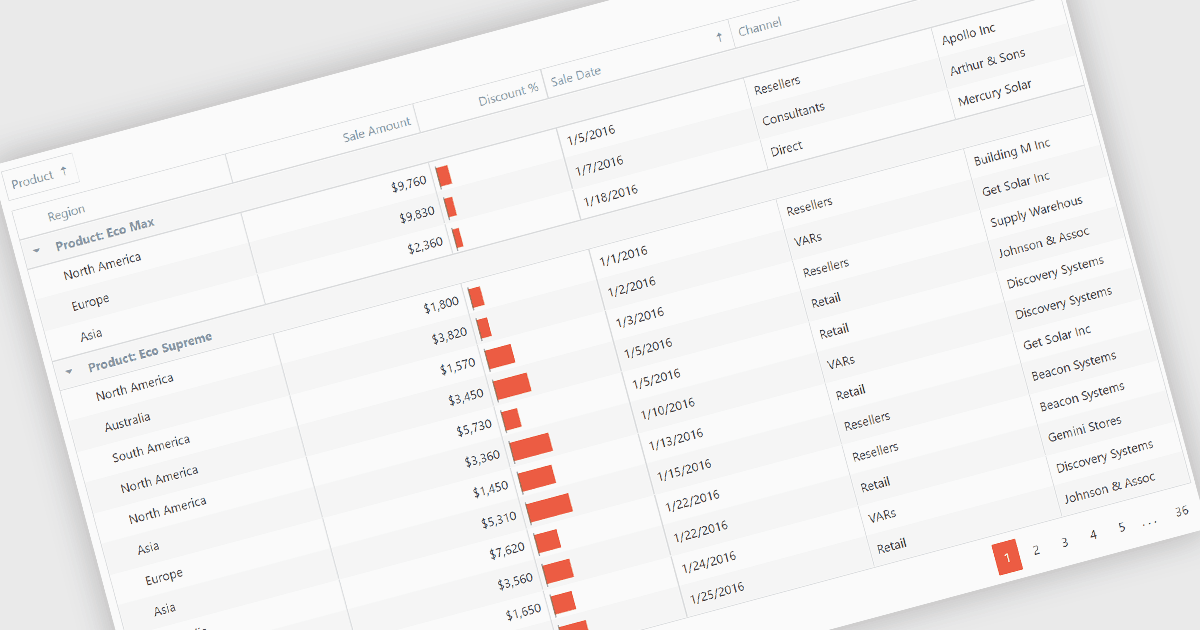
将网格数据组织到不同的组中

9月 26, 2024
在网格中对数据进行分组允许用户直观地表示数据点之间的关系,从而更容易识别模式和趋势。

继续用英语阅读:

Grouping grid data organizes the data into distinct groups within a grid-like structure. It involves visually clustering related data points together, often using color, shading, or borders, to enhance pattern recognition and make complex datasets more understandable. This method is useful for identifying trends, outliers, and correlations within large amounts of information.

Several Angular grid controls offer support for grouping including:

  • DevExtreme HTML5 JavaScript Data Grid (part of DevExtreme Complete by DevExpress) lets you group data dynamically using multiple levels, providing a flexible view.
  • Wijmo FlexGrid (part of Wimo by MESCIUS) allows you to create custom group headers and customize group appearance for a tailored experience.
  • Kendo UI for Angular Grid (part of Kendo UI by Telerik) allows you to create visually appealing and interactive grids with built-in grouping features.
  • Syncfusion Grid control for JavaScript (part of Syncfusion Essential Studio Enterprise) provides grouping features, including nesting and summaries for detailed insights.

For an in-depth analysis of features and price, visit our Angular grid controls comparison.

Compare Angular Grid Controls