使用多种折线表示方式对指标进行对比
折线图能够实现多个数据集的可视化与对比,突出它们之间的关系、趋势以及差异,从而揭示相关性。
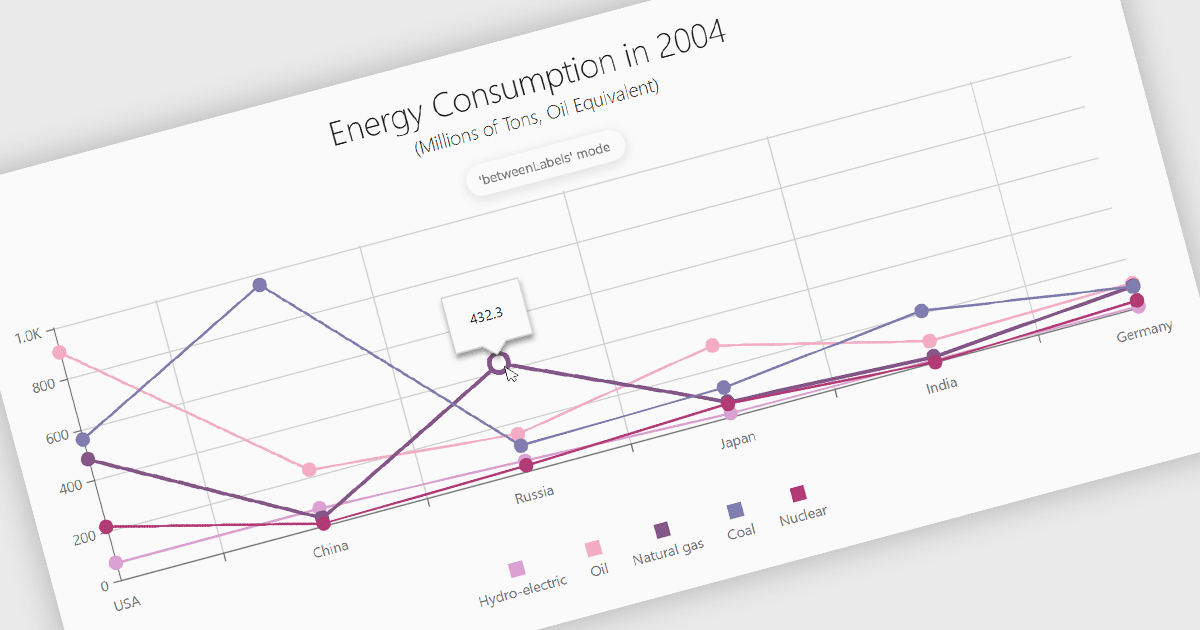
折线图是一种基础的数据可视化工具,用于通过直线连接数据点来表示连续区间内的定量值,例如时间。它们特别适用于分析趋势、对比多个数据集,并在大型或复杂数据集中识别关系或模式。对于软件开发人员而言,折线图以清晰且高效的方式呈现动态数据,支持交互式功能以便进行更深入的分析,并通过可自定义且直观的格式,让关键洞察变得易于获取,从而增强决策能力。
多种 Angular 图表控件提供折线图功能,包括:
- DevExtreme Chart(属于 DevExpress 的 DevExtreme Complete)让你能够构建具有响应式设计、高性能和无缝集成的交互式折线图。
- Kendo UI for Angular Chart (属于 Telerik 的 Kendo UI)可让你创建可自定义、功能丰富的折线图,并针对 Angular 应用进行优化,且具备出色的性能。
- Ignite UI for Angular Chart (属于 Infragistics Ignite UI)便于创建高级折线图,支持具有丰富交互性的实时数据可视化。
- FusionCharts Suite XT提供灵活的折线图绘制能力,可为复杂数据表示带来视觉吸引力十足的跨平台图表。
想深入了解功能与价格,请访问我们的 Angular 图表对比。