使用紧凑型微型折线图简化分析
借助嵌入到应用中的省空间微型折线图,轻松识别趋势、监控实时变化,并提升数据可读性。
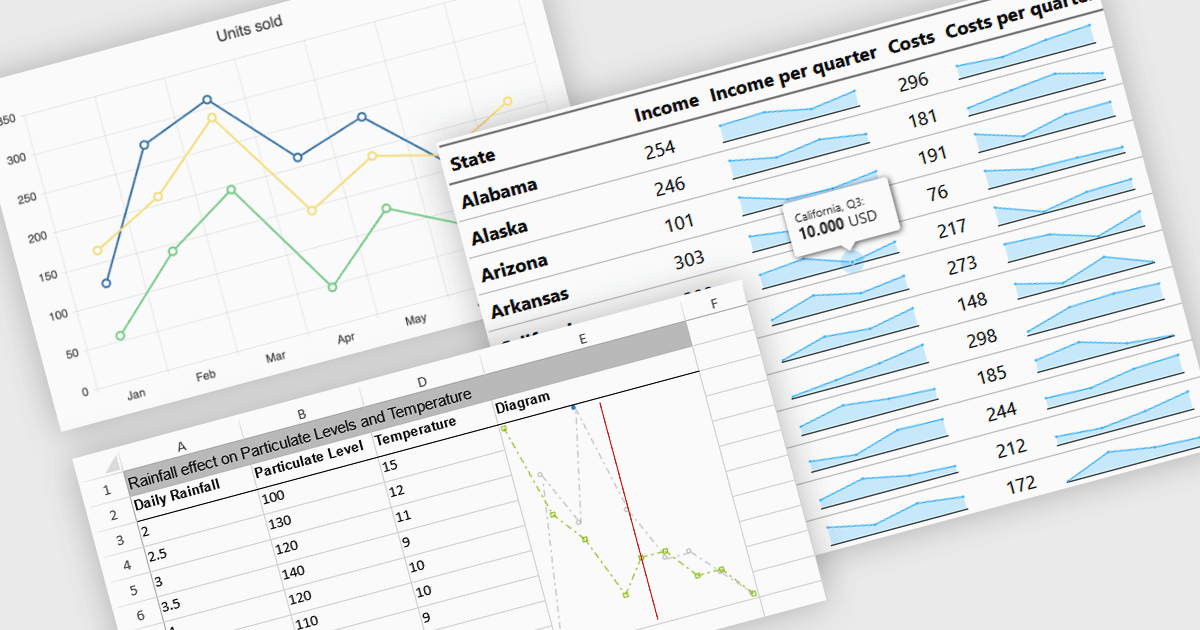
微型折线图(Sparkline charts)是一种紧凑、信息密度高的可视化形式,用于以极简的方式展示趋势、模式和变化。与传统图表不同,它们能够节省空间,并可无缝集成到表格、仪表盘或报告中,帮助你快速获得洞察。这些图表尤其适用于识别随时间变化的趋势、监控实时变化,以及提升数据可读性。常见应用场景包括:金融报告中跟踪股票表现、销售仪表盘中可视化营收波动,以及性能监控工具中突出系统指标。凭借其能够以直观、视觉化的方式快速传达关键信息的能力,微型折线图是数据驱动决策的重要工具。
多种 React 图表提供微型折线图支持,包括:
- DevExtreme Chart(属于 DevExpress 的 DevExtreme Complete)让你能够在仪表盘、网格和报告中集成交互式微型折线图,用于趋势可视化。
- Ignite UI for React Chart(属于 Infragistics Ignite UI)提供轻量级微型折线图,用于在表格、金融报告和分析仪表盘中进行数据可视化。
- KendoReact Chart (属于 Telerik 的 KendoReact)支持嵌入微型折线图,以在表格和仪表盘中突出趋势、波动以及对比信息。
- Highcharts Gantt(由 Highsoft 提供)包含用于项目进度跟踪、资源利用率和性能趋势的微型折线图,可用于基于时间轴的可视化。
如需深入了解功能与价格,请访问我们的 React 图表对比。