用可视化数据点揭示相关性
借助直观的散点图,直观探索关系、离群值以及数据范围,从而实现清晰理解与更有依据的分析。
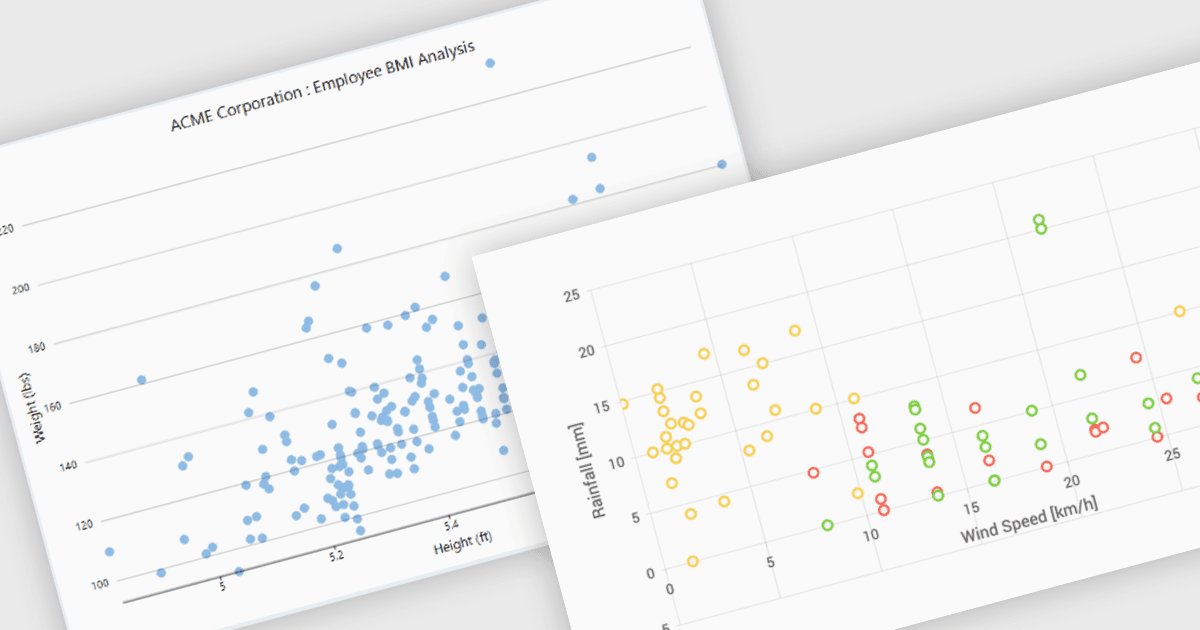
散点图(也称为散点绘图或散点图表)是一种基础可视化工具,用于通过绘制数据点来探索两个连续变量之间的关系。其中,每个数据点的位置由这两个变量对应的数值决定。此视觉表示能够有效揭示相关性,并帮助识别离群值、聚类,以及数据的整体范围和分布。使用散点图的好处包括:它在传达复杂关系方面足够简单、能够突出可能在表格数据中被忽略的异常现象,以及它作为回归等更高级统计分析的前奏作用。
多种 .NET WinForms 图表控件提供散点图,包括:
- DevExpress WinForms Chart (DevExpress WinForms 的一部分)通过交互式散点图来可视化相关性与分布,从而便于进行富有洞察力的数据分析,并提供丰富的样式选项。
- TeeChart WinForms 由 Steema Software 提供,支持开发人员创建多种散点系列,可自定义点样式、进行趋势线分析,并提供缩放功能,以实现对数据的细致探索。
- Syncfusion WinForms Chart(Syncfusion Essential Studio Enterprise 的一部分)可创建视觉效果出色的散点图,具备数据标签、工具提示以及用于比较关系分析的多个系列等功能。
- ProEssentials 由 GigaSoft 提供,提供高性能散点图,用于快速、实时、交互式地探索数据,并揭示趋势、聚类与离群值,从而支持更明智的分析。
如需深入了解功能与价格,请访问我们的 .NET WinForms 图表控件对比。