使用数据透视表汇总大型数据集
通过电子表格中的数据透视表发现规律,让交互式分析从各个角度揭示趋势与绩效。
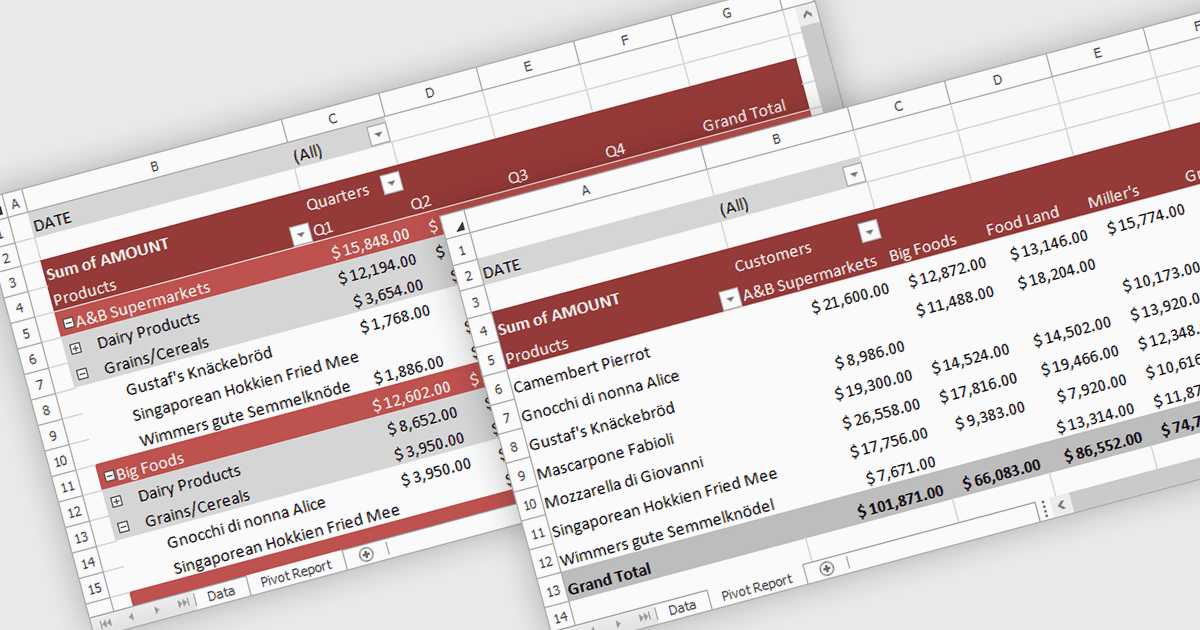
电子表格中的数据透视表可让你通过动态分组、筛选和汇总数据,快速概括并探索大量数据集。它会自动计算总计、平均值、计数以及其他指标,从而减少对复杂公式的依赖。这使你更容易发现趋势、模式和异常值,例如按地区和产品对销售进行对比、按部门分析成本,或跟踪随时间变化的绩效。通过将原始数据转化为清晰的、可交互的汇总内容,数据透视表帮助用户做出更快、更明智的决策。
多种 .NET Core 电子表格控件支持数据透视表,包括:
- DevExpress WinForms Spreadsheet(DevExpress WinForms 的一部分)可让你创建数据透视表,对大型数据集进行汇总、筛选和分析,并提供富有洞察力的数据探索。
- Document Solutions for Excel, .NET Edition(MESCIUS 出品)支持高级数据透视表创建,可用于快速汇总数据并进行多维分析。
- EPPlus(EPPlus Software 出品)允许你以编程方式构建强大的数据透视表,从而在 Excel 文件中实现灵活的数据分组、汇总以及可定制的报表输出。
- IronXL for .NET(Iron Software 出品)便于在代码中生成数据透视表,帮助你将原始电子表格数据转化为清晰的汇总、对比以及洞察信息。
想了解更多功能与价格信息,请访问我们的 .NET Core 电子表格控件对比。