用紧凑的单元格内视觉效果发现趋势
通过紧凑的迷你图获取对电子表格数据的清晰洞察:它们揭示趋势、突出关键点,并简化有意义的对比。
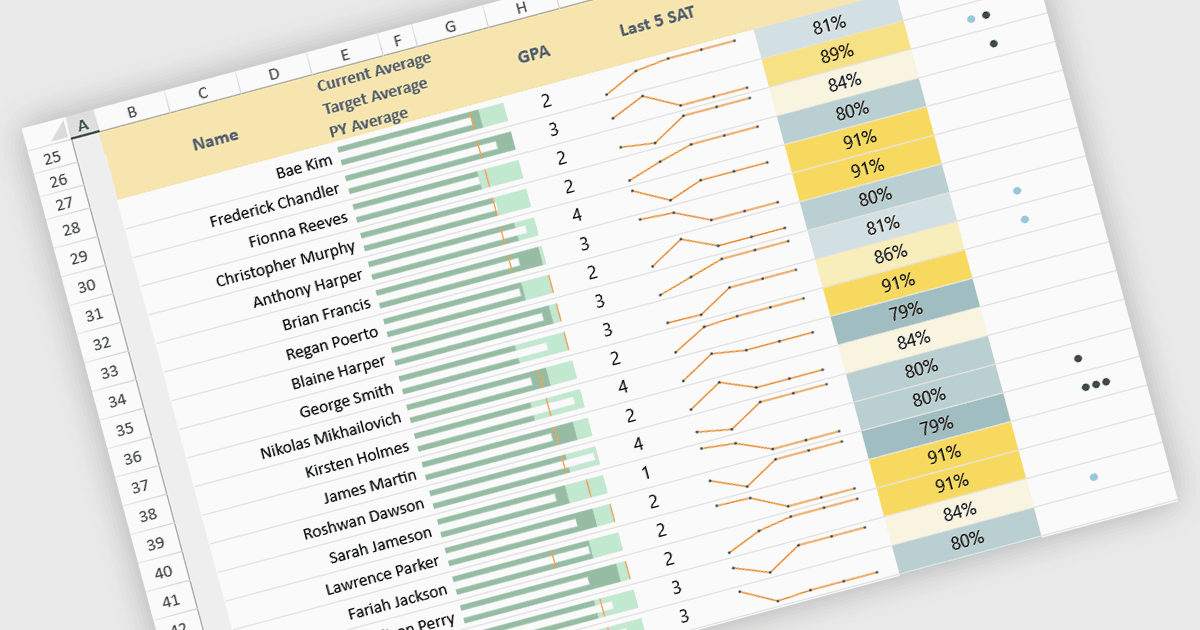
电子表格中的迷你图(Sparklines)是单元格内的小型图表,用于在不需要完整尺寸图表的情况下,对数据趋势进行简洁的可视化总结。它们帮助用户快速识别诸如增长、下滑和波动等模式,使复杂信息一眼就更易理解。由于迷你图会随着底层数据自动更新,它们提升了实时分析能力,非常适用于仪表盘、绩效追踪以及财务报表等场景。常见用例包括监控每月销售表现、将各产品的趋势并排进行对比、发现运营指标中的异常,并通过清晰且节省空间的可视化上下文来增强高管摘要。
一些 JavaScript 电子表格控件提供迷你图功能:
- SpreadJS(MESCIUS)让你可以在电子表格中嵌入动态迷你图,从而实现清晰的趋势可视化、实时洞察,并提供紧凑的数据报表能力。
- Infragistics Ultimate UI for jQuery Excel Library(Infragistics Professional 的一部分)允许你创建用于可视化趋势的电子表格迷你图,并帮助突出关键指标。
- Jspreadsheet Pro 便于在电子表格中添加响应式迷你图,使你能够快速识别趋势、改进报表,并在不同数据集之间进行直观对比。
如需深入了解功能与价格,请访问我们对 JavaScript 电子表格控件的对比。