用交互式透视图可视化趋势
JavaScript UI 套件中的透视图组件能够简化复杂的数据可视化,提供灵活的分析能力。
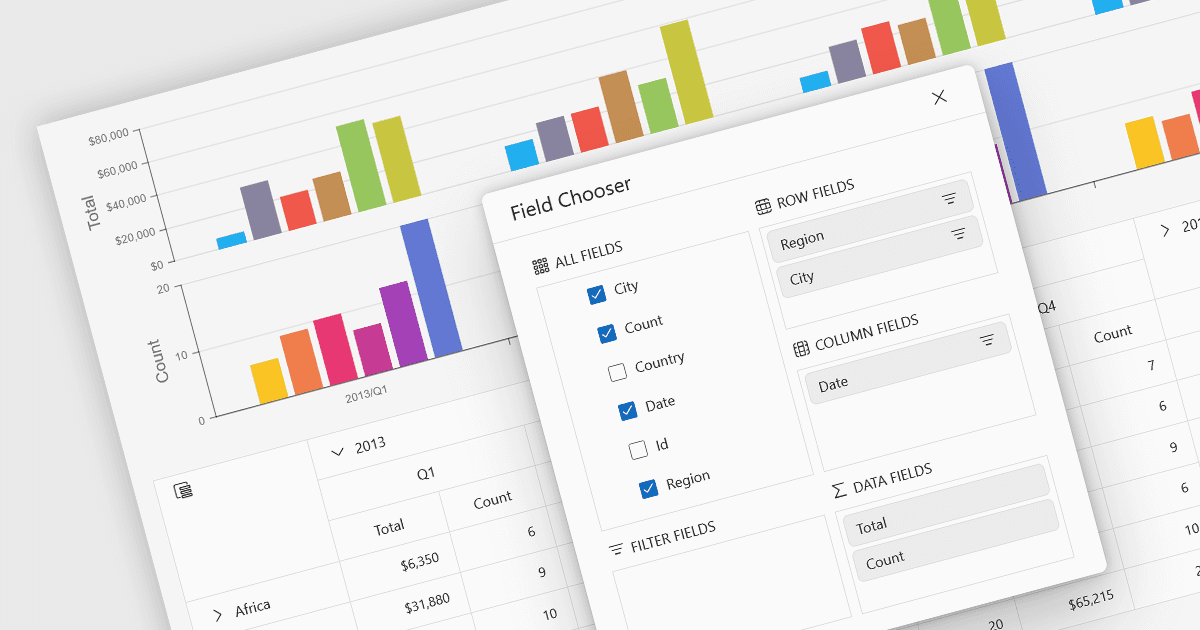
透视图(Pivot chart)是一种动态的数据可视化工具,可与透视表(pivot table)配合使用,以图形化方式呈现汇总后的数据。它允许用户通过调整类别、系列和筛选器等维度进行交互式探索与分析大型数据集,而无需修改底层数据。通过对趋势、对比和模式的直观展示,透视图帮助用户更高效地做出数据驱动的决策。在需要对聚合数据进行清晰且灵活的展示的商业智能和报表场景中,它们尤其有用。
一些 JavaScript UI 套件提供了透视图功能,包括:
- DevExtreme Complete 让你能够将类似透视的数据信息汇总与交互式图表集成:在 JavaScript 应用中,网格数据驱动视觉分析。
- Wijmo(MESCIUS 出品)可让你绑定其 OLAP 和 PivotChart 控件,使透视引擎的汇总结果能够供 FlexChart 进行可视化,展示所选的聚合值。
- SmartClient(Isomorphic Software 出品)可让你借助其图表组件可视化多维透视数据,从而实现动态透视,并更新汇总图表。
- Syncfusion Essential Studio Enterprise 允许开发人员在交互式透视图中展示聚合透视表结果,支持多种图表类型、下钻(drill‑down)以及自定义。
如需更深入了解功能与价格,请访问我们的 UI 套件对比。