用范围图表清晰对比数值
借助范围面积图(range area charts)获取金融洞察:它会可视化两个数据点之间的数值区间,从而揭示价格区间、预测结果和趋势。
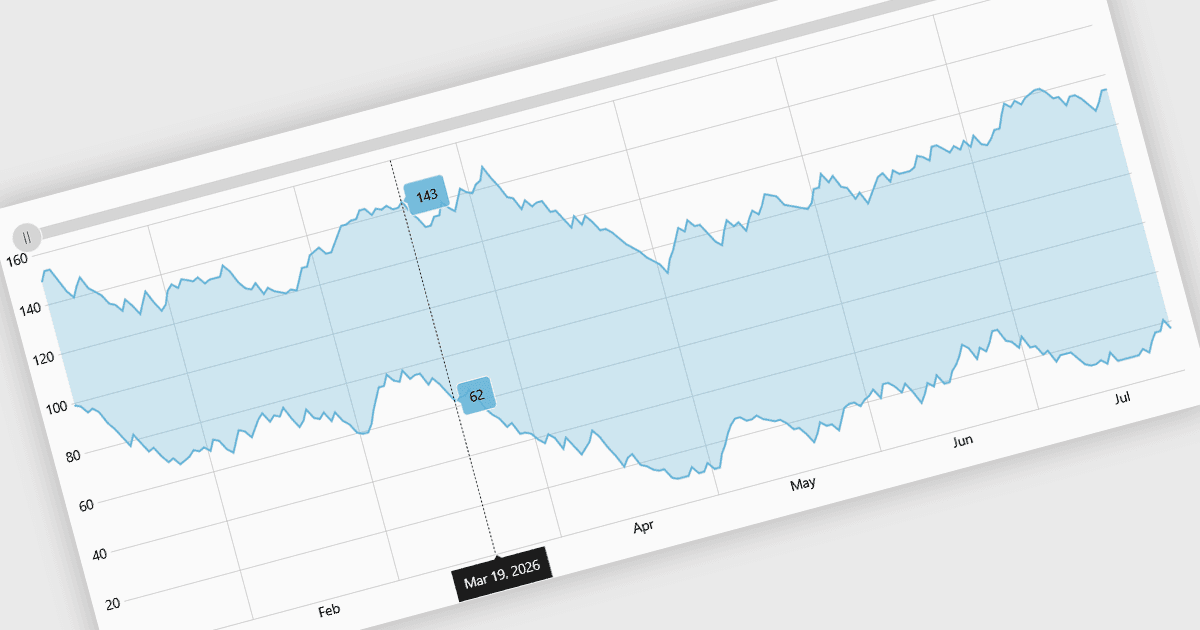
范围图表(Range charts)基于固定的价格波动来可视化金融数据,而不是按时间间隔划分。它们将活动归组到一致的区间中,以突出有意义的价格走势。通过过滤掉轻微波动和市场噪声,范围图更容易让人识别趋势、波动性,以及支撑与阻力水平,尤其适用于快速波动或不规则的市场。常见用例包括:用于交易平台的技术分析、用于监控股票或加密货币价格波动,以及用于分析高频金融数据——在这些场景中,理解真实的市场行为往往比追踪基于时间的变化更重要。
一些 React 图表组件提供了范围图表(range charts),包括:
- DevExtreme React Chart(Devexpress 的 DevExtreme Complete 组成部分)让你能够构建强调价格波动并有助于进行精准趋势分析的金融范围图表。
- amCharts 5: Charts 便于创建交互式范围图表:它会过滤掉细微波动,并以清晰直观的方式有效呈现底层价格趋势。
- AnyChart JS 让你为金融仪表盘实现灵活的范围图表,从而提升波动性分析、模式识别以及决策准确性与速度。
- Infragistics Ignite UI for React Chart(Infragistics Ignite UI 组成部分)可用于可视化波动市场中的范围图表,展现动能与洞察。
想了解更多功能与价格方面的细节,请访问我们的 React 图表控件对比。