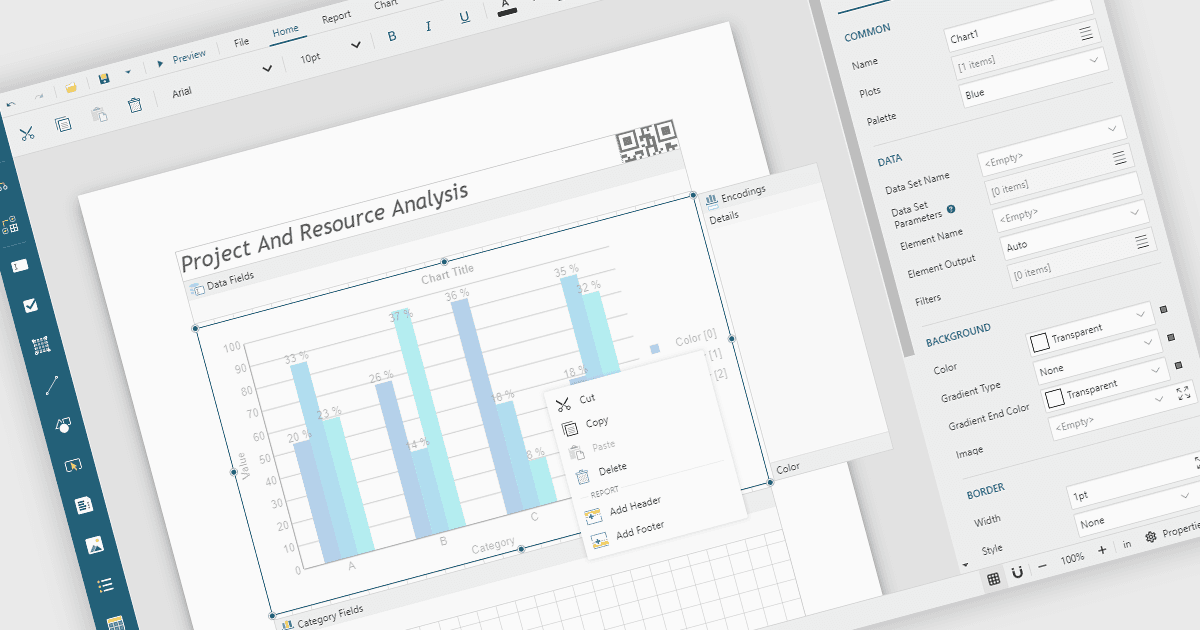
轻松直观设计专业报表

2月 18, 2026
为任何受众创建可互动、分析且打印就绪的报表,带有拖放设计、可定制模板和一致的品牌形象。

继续用英语阅读:

A Visual Report Designer is an application that enables users to create interactive, analytical, and print-ready reports using an intuitive, drag-and-drop interface. It supports fully customizable templates and data visualization components, helping teams present complex information clearly while maintaining consistent branding and layouts. Typical use cases include executive dashboards, financial and operational reports, customer analytics summaries, compliance documents, and branded client-facing reports.

Several JavaScript reporting components offer visual report designers including:

  • DevExpress Reporting lets you design interactive, print-ready reports with a visual designer and comprehensive data visualization tools.
  • ActiveReportsJS by MESCIUS allows you to create customizable web-based reports using a modern visual designer and flexible JavaScript reporting components.
  • Stimulsoft Reports.JS facilitates building dynamic, browser-based reports through an intuitive visual designer and rich interactive data presentation features.

For an in-depth analysis of features and price, visit our JavaScript reporting comparison.

Compare JavaScript Reporting Controls