在 Vue.js 应用中构建交互式饼图
使用带有工具提示、图例、标签和动画的响应式饼图,可视化类别比例。
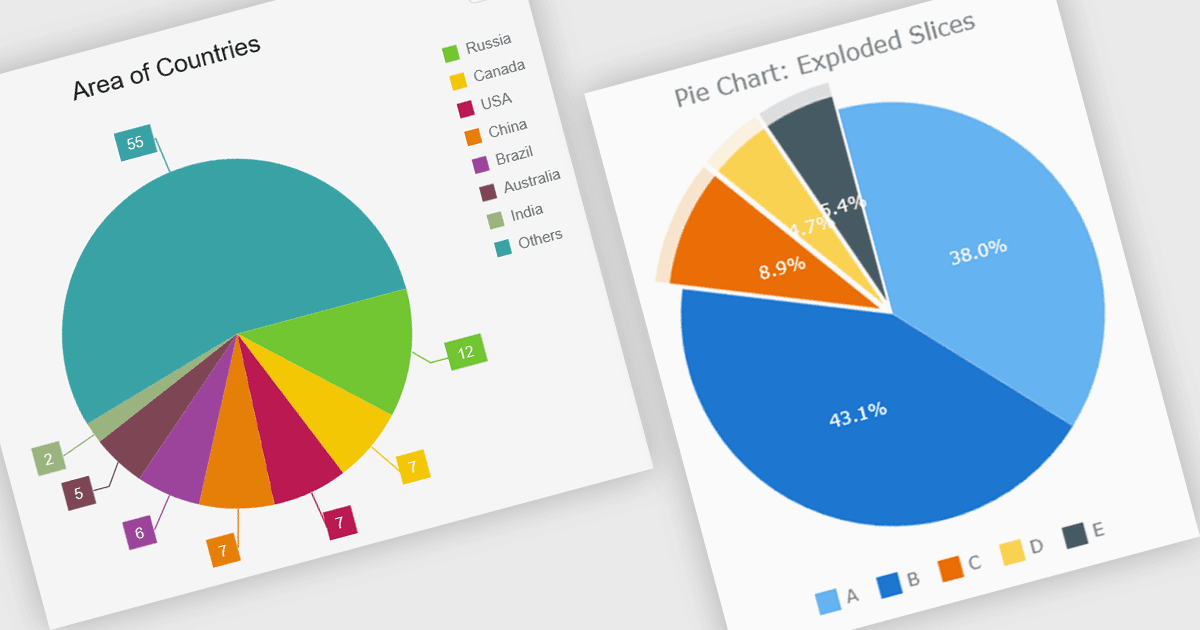
饼图使开发人员能够将数据以圆形的比例切片展示,每个切片代表某个类别在总量中的占比。饼图非常适合展示部分与整体的关系,使用户可以一目了然地比较相对比例。设计良好的实现通常包含交互式功能,如工具提示、图例、标签、动画、自适应布局和定制选项,使图表能整洁地集成到现代Web应用中,同时提供清晰易懂的组成数据展示方式。
多个 Vue.js 图表组件支持饼图,包括:
- Highcharts Core 允许您创建具有丰富定制、响应式布局、动画、工具提示、图例和灵活样式选项的交互式饼图。
- DevExtreme Vue Chart(属于 DevExtreme Complete by DevExpress)允许您构建响应式
- 具有可定制切片、标签、图例、动画和交互式工具提示的饼图。
- Kendo UI Vue Charts(属于 Telerik 的 Kendo UI)便于创建带有可配置标签、图例、工具提示、样式和响应式渲染的图表。
- AnyChart JS 允许您开发具有交互式工具提示、可配置标签、分离切片、响应式布局及丰富外观选项的可定制饼图。
有关功能和价格的深入分析,请访问我们的 Vue.js 图表组件比较页面。