透過在 ASP.NET Core 試算表中新增圖表來呈現資料
使用圖表將試算表的資料與趨勢可視化,提升資料溝通並強化決策品質。
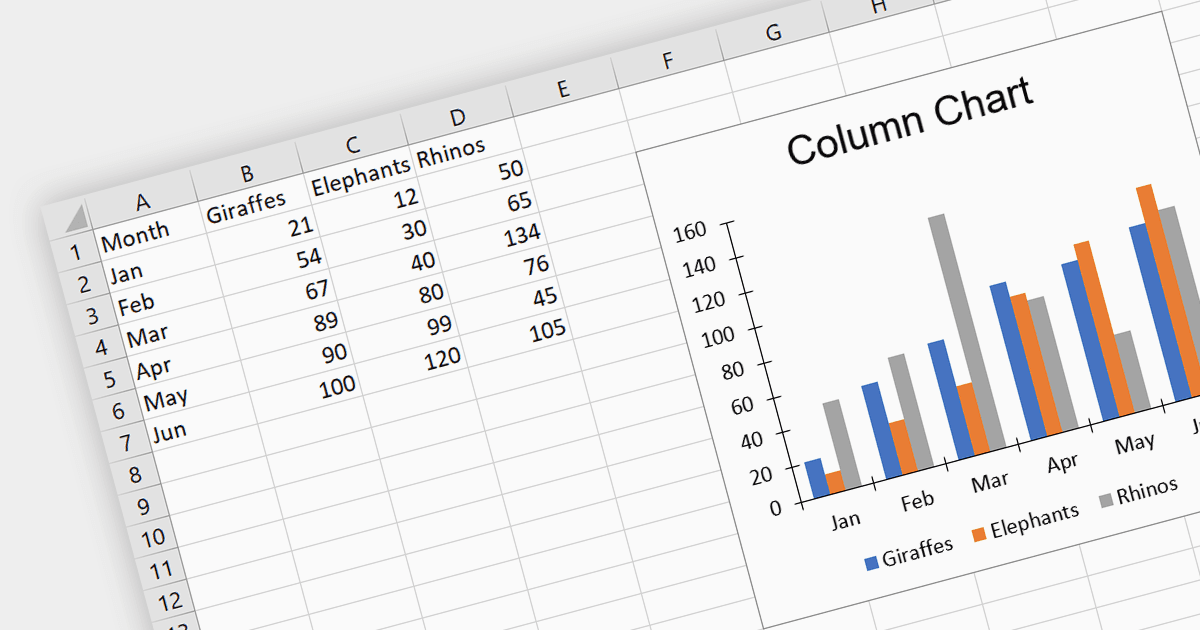
圖表有助於將複雜的數值試算表資料轉換為容易理解的圖形表示。它們讓你更容易在資料中辨識模式、趨勢與關聯,從而能更快速地理解並找出關鍵洞察。這種視覺化方式能增強溝通,並促進做出有根據的決策。圖表特別適用於簡報與效能追蹤,讓你能有效分享並傳播洞察。
多個 ASP.NET Core 試算表控制項提供圖表功能,包括:
- IronXL 由 Iron Software 提供,是一款輕量且易於使用的函式庫,可用於在 ASP.NET Core 試算表中建立圖表。它支援多種圖表類型,例如長條圖、折線圖、圓餅圖與散點圖。
- Document Solutions for Excel, .NET Edition 由 MESCIUS(先前為 GrapeCity)提供,是一套用於在 ASP.NET Core 應用程式中處理 Excel 檔案的完整函式庫。它包含強大的圖表模組,支援廣泛的圖表類型與自訂選項。
- Aspose.Cells for .NET 是一套成熟且功能豐富的函式庫,可用於在 ASP.NET Core 試算表中建立圖表。它支援各種圖表,包括自訂圖表類型。
或者,許多試算表控制項也可作為多功能套件的一部分使用:
- DevExpress ASP.NET Core Spreadsheet(屬於 DevExpress ASP.NET 與 Blazor)是一款廣受歡迎且支援完善的試算表元件,支援新增圖表。它提供直覺易用的介面,並支援完整的圖表類型範圍與廣泛的自訂可能性。
- Infragistics ASP.NET Core Spreadsheet(屬於 Infragistics Ignite UI)是一套強大且多功能的函式庫,讓你可以在 ASP.NET Core 試算表中建立圖表。它提供大量圖表類型函式庫,以及精細的自訂控制項,用於打造專屬的圖表。
- Syncfusion ASP.NET Core Spreadsheet(屬於 Syncfusion Essential Studio Enterprise)是一個高效能的 ASP.NET Core 元件,可讓你在試算表中建立圖表。它包含豐富的圖表類型,並提供多樣的自訂選項,讓你能針對受眾與資料調整圖表內容。
如需更深入的功能與價格分析,請參考我們的 ASP.NET Core 試算表比較。