在你的 Blazor App 中管理專案
提供使用者甘特圖,清楚且精簡地概覽專案時程、相依性與進度。
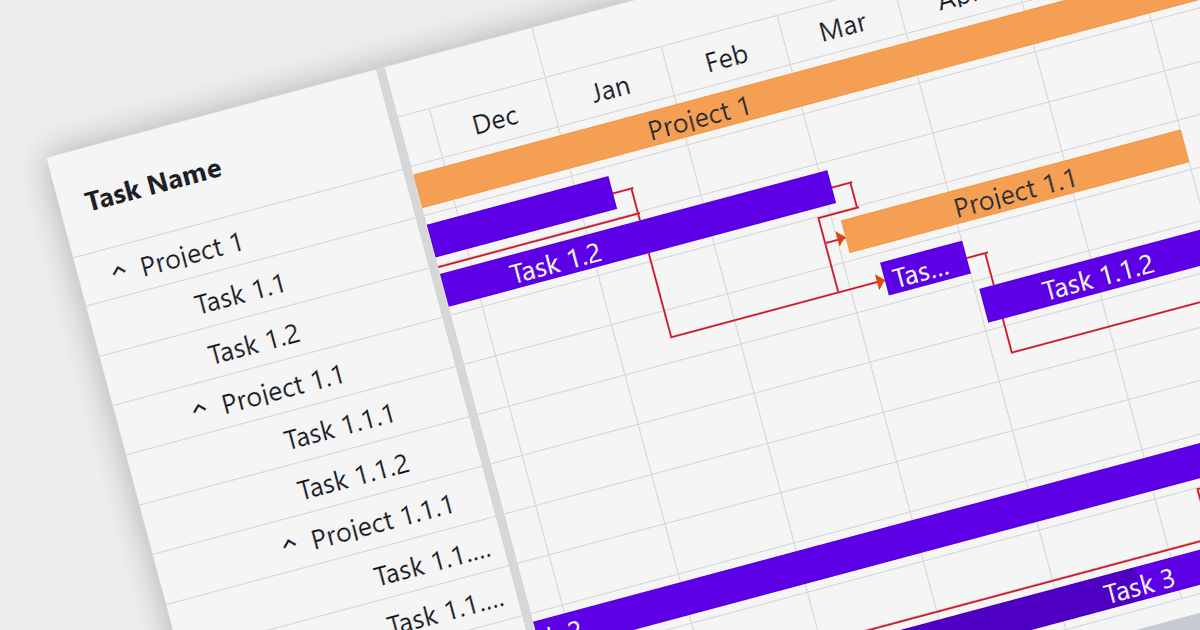
甘特圖是一種條狀圖,設計用來說明專案排程。它們會顯示專案中不同元素的開始與結束日期,是專案管理不可或缺的工具。這些圖表能透過呈現專案工作項目之間如何重疊以及彼此之間的關聯,來協助追蹤專案進度並進行規劃。
多種 Blazor 圖表元件提供甘特圖,包括:
- ComponentOne Charts for Blazor(屬於 MESCIUS 的 ComponentOne Studio Blazor Edition)包含強大且可自訂的 Blazor 甘特圖,適用於 Blazor 應用程式。
- Telerik Blazor Chart(屬於 Telerik UI for Blazor)可顯示功能豐富的甘特圖,並提供互動式資料視覺化功能。
- Syncfusion Blazor Chart(屬於 Syncfusion Essential Studio Enterprise)附有完整的甘特圖,並支援原生 Blazor。
- Smart HTML Elements Blazor Chart(屬於 Smart HTML Elements)提供易於使用的甘特圖,協助建立現代化的 Blazor UI。
- TeeChart Blazor(屬於 Steema Software 的 by TeeChart .NET for Blazor)包含多用途的甘特圖,並提供多種客製化選項。
如需深入了解功能與價格,請造訪我們的 Blazor Charts 比較。